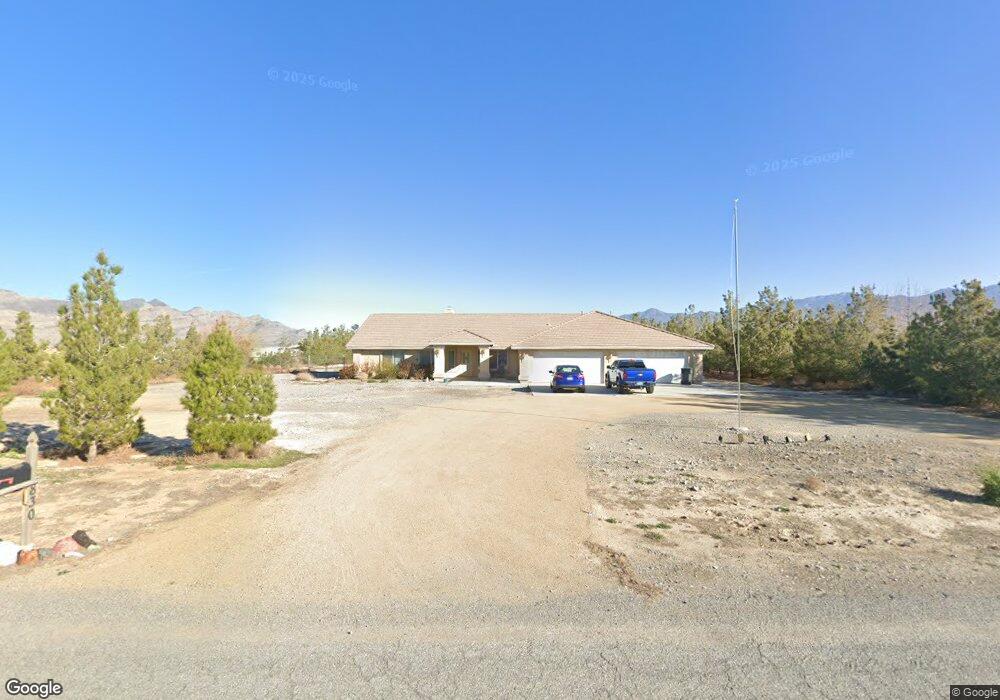
830 Jarvis Rd Unit 3 Pahrump, NV 89060
Estimated Value: $501,000 - $575,000
--
Bed
--
Bath
2,729
Sq Ft
$194/Sq Ft
Est. Value
About This Home
This home is located at 830 Jarvis Rd Unit 3, Pahrump, NV 89060 and is currently estimated at $529,275, approximately $193 per square foot. 830 Jarvis Rd Unit 3 is a home located in Nye County with nearby schools including Manse Elementary School, Rosemary Clarke Middle School, and Pahrump Valley High School.
Ownership History
Date
Name
Owned For
Owner Type
Purchase Details
Closed on
Mar 7, 2011
Sold by
Dahlke Darin R
Bought by
Hsbc Bank Usa National Association
Current Estimated Value
Home Financials for this Owner
Home Financials are based on the most recent Mortgage that was taken out on this home.
Original Mortgage
$146,099
Interest Rate
4.75%
Mortgage Type
FHA
Purchase Details
Closed on
Mar 6, 2011
Sold by
Hsbc Bank Usa National Association
Bought by
Clough Richard D
Home Financials for this Owner
Home Financials are based on the most recent Mortgage that was taken out on this home.
Original Mortgage
$146,099
Interest Rate
4.75%
Mortgage Type
FHA
Purchase Details
Closed on
Apr 25, 2006
Sold by
Dahlke Darin Richard
Bought by
Dahlke Darin R
Home Financials for this Owner
Home Financials are based on the most recent Mortgage that was taken out on this home.
Original Mortgage
$281,000
Interest Rate
6.29%
Mortgage Type
Fannie Mae Freddie Mac
Create a Home Valuation Report for This Property
The Home Valuation Report is an in-depth analysis detailing your home's value as well as a comparison with similar homes in the area
Home Values in the Area
Average Home Value in this Area
Purchase History
| Date | Buyer | Sale Price | Title Company |
|---|---|---|---|
| Hsbc Bank Usa National Association | $150,777 | Accommodation | |
| Clough Richard D | $150,000 | Ticor Title Las Vegas | |
| Dahlke Darin R | -- | Commonwealth Land Title Ins |
Source: Public Records
Mortgage History
| Date | Status | Borrower | Loan Amount |
|---|---|---|---|
| Previous Owner | Clough Richard D | $146,099 | |
| Previous Owner | Dahlke Darin R | $281,000 |
Source: Public Records
Tax History Compared to Growth
Tax History
| Year | Tax Paid | Tax Assessment Tax Assessment Total Assessment is a certain percentage of the fair market value that is determined by local assessors to be the total taxable value of land and additions on the property. | Land | Improvement |
|---|---|---|---|---|
| 2025 | $2,545 | $110,774 | $5,702 | $105,072 |
| 2024 | $2,545 | $111,838 | $4,135 | $107,703 |
| 2023 | $2,545 | $101,429 | $4,135 | $97,294 |
| 2022 | $2,184 | $91,043 | $4,135 | $86,908 |
| 2021 | $2,027 | $87,055 | $3,308 | $83,747 |
| 2020 | $1,947 | $86,801 | $3,308 | $83,493 |
| 2019 | $1,822 | $99,681 | $3,308 | $96,373 |
| 2018 | $1,740 | $89,933 | $2,646 | $87,287 |
| 2017 | $1,672 | $72,148 | $2,646 | $69,502 |
| 2016 | $1,630 | $54,798 | $2,646 | $52,152 |
| 2015 | $1,627 | $50,700 | $2,646 | $48,054 |
| 2014 | $1,578 | $45,121 | $2,646 | $42,475 |
Source: Public Records
Map
Nearby Homes
- 890 W Mcmurray Dr
- 711 Jarvis Rd
- 800 Gally Rd
- 681 Indian Wells Ct
- 3630 N Linda St
- 561 Jarvis Rd
- 710 Tomahawk Ct
- 521 W Simkins Rd
- 590 W Tomahawk Ct
- 451 W Leffner Dr
- 541 Tomahawk Ct
- 421 Mcmurray Dr
- 511 Tomahawk Ct
- 1310 W Scales Way
- 3200 Florenza St
- 351 Bunarch Rd
- 421 Granite St
- 400 Granite St
- 380 Granite St
- 231 Bunarch Rd