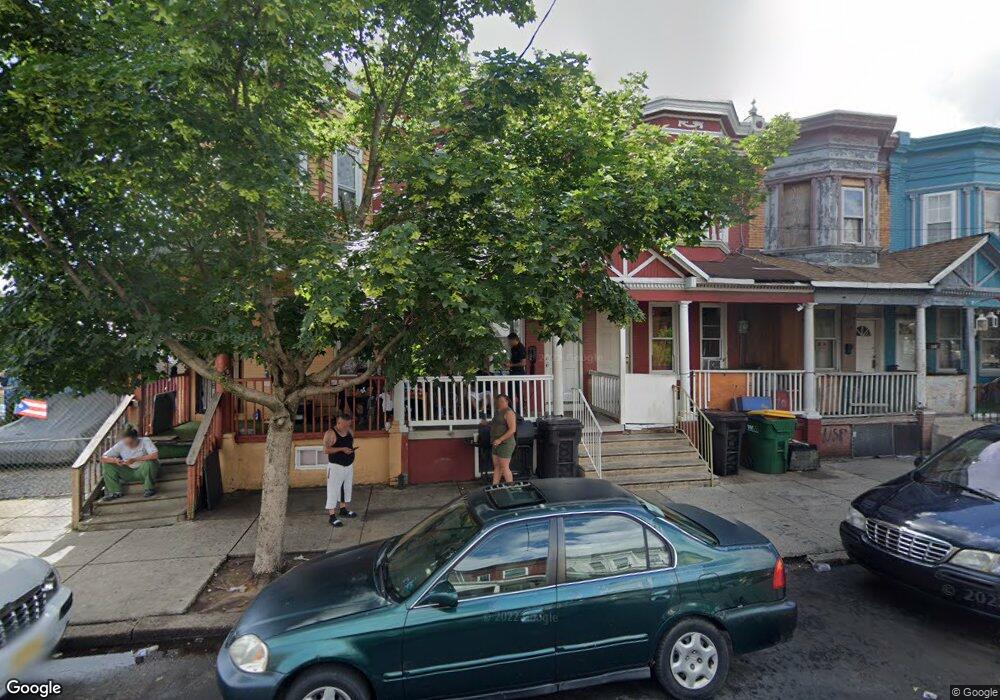
830 N 8th St Camden, NJ 08102
North Camden NeighborhoodEstimated Value: $75,000 - $175,000
--
Bed
--
Bath
1,158
Sq Ft
$102/Sq Ft
Est. Value
About This Home
This home is located at 830 N 8th St, Camden, NJ 08102 and is currently estimated at $118,476, approximately $102 per square foot. 830 N 8th St is a home located in Camden County with nearby schools including Eastside High School, Leap Academy University Charter School, and Holy Name School.
Ownership History
Date
Name
Owned For
Owner Type
Purchase Details
Closed on
Jul 21, 2023
Sold by
Real Portfolio 12 Llc
Bought by
Real Portfolio 17 Llc
Current Estimated Value
Home Financials for this Owner
Home Financials are based on the most recent Mortgage that was taken out on this home.
Original Mortgage
$3,305,500
Interest Rate
6.81%
Mortgage Type
New Conventional
Purchase Details
Closed on
Oct 3, 2022
Sold by
Mary Rose 22 Llc
Bought by
Real Portfolio 12 Llc
Purchase Details
Closed on
Sep 22, 2022
Sold by
Rodriguez William
Bought by
Legacies Asset Mgmt Llc
Purchase Details
Closed on
Dec 26, 2018
Sold by
Pciii Reo Llc
Bought by
Rodriguez William
Purchase Details
Closed on
Aug 20, 2003
Sold by
Brown Pamela Jackson
Bought by
Olavarria Jose
Create a Home Valuation Report for This Property
The Home Valuation Report is an in-depth analysis detailing your home's value as well as a comparison with similar homes in the area
Home Values in the Area
Average Home Value in this Area
Purchase History
| Date | Buyer | Sale Price | Title Company |
|---|---|---|---|
| Real Portfolio 17 Llc | -- | Brennan Title Abstract | |
| Real Portfolio 12 Llc | $55,000 | Brennan Title Abstract | |
| Real Portfolio 12 Llc | $55,000 | Brennan Title Abstract | |
| Legacies Asset Mgmt Llc | -- | Sjs Title | |
| Legacies Asset Mgmt Llc | -- | Sjs Title | |
| Rodriguez William | -- | None Available | |
| Olavarria Jose | -- | -- |
Source: Public Records
Mortgage History
| Date | Status | Borrower | Loan Amount |
|---|---|---|---|
| Previous Owner | Real Portfolio 17 Llc | $3,305,500 |
Source: Public Records
Tax History Compared to Growth
Tax History
| Year | Tax Paid | Tax Assessment Tax Assessment Total Assessment is a certain percentage of the fair market value that is determined by local assessors to be the total taxable value of land and additions on the property. | Land | Improvement |
|---|---|---|---|---|
| 2025 | $1,616 | $45,600 | $6,100 | $39,500 |
| 2024 | $1,562 | $45,600 | $6,100 | $39,500 |
| 2023 | $1,562 | $45,600 | $6,100 | $39,500 |
| 2022 | $1,533 | $45,600 | $6,100 | $39,500 |
| 2021 | $1,527 | $45,600 | $6,100 | $39,500 |
| 2020 | $1,450 | $45,600 | $6,100 | $39,500 |
| 2019 | $1,389 | $45,600 | $6,100 | $39,500 |
| 2018 | $1,381 | $45,600 | $6,100 | $39,500 |
| 2017 | $1,347 | $45,600 | $6,100 | $39,500 |
| 2016 | $1,305 | $45,600 | $6,100 | $39,500 |
| 2015 | $1,256 | $45,600 | $6,100 | $39,500 |
| 2014 | $1,226 | $45,600 | $6,100 | $39,500 |
Source: Public Records
Map
Nearby Homes