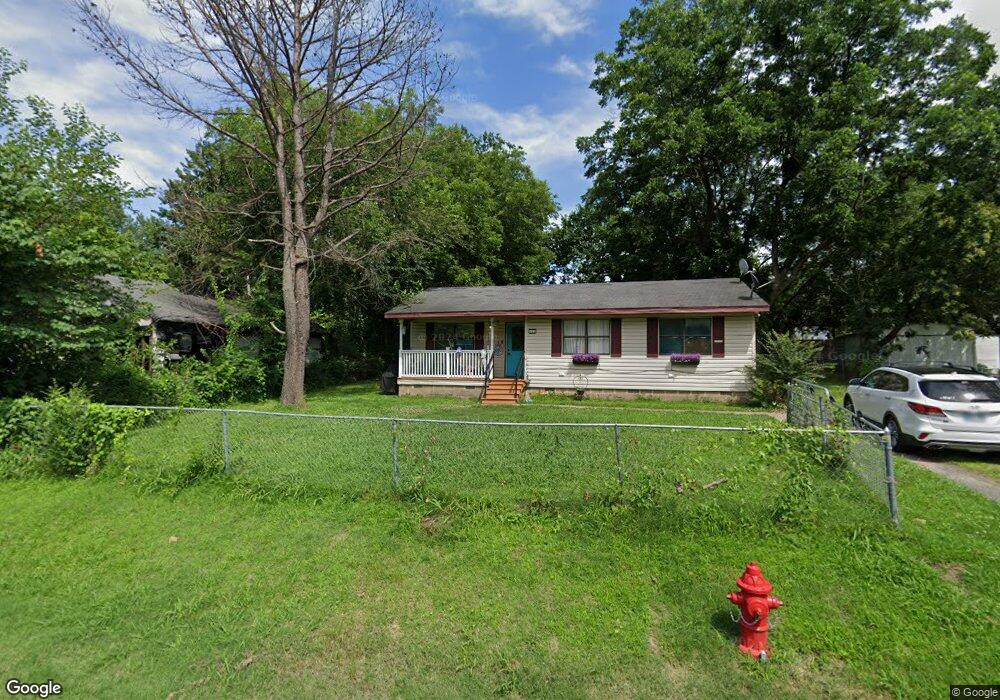
830 N B St Muskogee, OK 74403
Central Muskogee NeighborhoodEstimated Value: $61,000 - $74,934
2
Beds
2
Baths
896
Sq Ft
$74/Sq Ft
Est. Value
About This Home
This home is located at 830 N B St, Muskogee, OK 74403 and is currently estimated at $66,734, approximately $74 per square foot. 830 N B St is a home located in Muskogee County with nearby schools including Irving Elementary School, 8th & 9th Grade Academy @ Alice Robertson, and Muskogee High School.
Ownership History
Date
Name
Owned For
Owner Type
Purchase Details
Closed on
May 24, 2022
Sold by
Danley Brian W
Bought by
Danley Brian W and Godwin Amber
Current Estimated Value
Purchase Details
Closed on
Feb 28, 2019
Sold by
Doughty Randy and Doughty Verna L
Bought by
Doughty Joshua and Doughty Emily
Home Financials for this Owner
Home Financials are based on the most recent Mortgage that was taken out on this home.
Original Mortgage
$16,892
Interest Rate
4.4%
Mortgage Type
Future Advance Clause Open End Mortgage
Purchase Details
Closed on
May 24, 2005
Sold by
Mccoy Sherry and Mccoy Gary D
Bought by
Doughty Randy and Doughty Verne
Home Financials for this Owner
Home Financials are based on the most recent Mortgage that was taken out on this home.
Original Mortgage
$31,920
Interest Rate
5.87%
Mortgage Type
New Conventional
Purchase Details
Closed on
Mar 1, 1989
Create a Home Valuation Report for This Property
The Home Valuation Report is an in-depth analysis detailing your home's value as well as a comparison with similar homes in the area
Home Values in the Area
Average Home Value in this Area
Purchase History
| Date | Buyer | Sale Price | Title Company |
|---|---|---|---|
| Danley Brian W | -- | None Listed On Document | |
| Doughty Joshua | $10,000 | First American Title Ins Co | |
| Doughty Randy | $40,000 | None Available | |
| -- | $1,000 | -- |
Source: Public Records
Mortgage History
| Date | Status | Borrower | Loan Amount |
|---|---|---|---|
| Previous Owner | Doughty Joshua | $16,892 | |
| Previous Owner | Doughty Randy | $31,920 |
Source: Public Records
Tax History Compared to Growth
Tax History
| Year | Tax Paid | Tax Assessment Tax Assessment Total Assessment is a certain percentage of the fair market value that is determined by local assessors to be the total taxable value of land and additions on the property. | Land | Improvement |
|---|---|---|---|---|
| 2024 | $582 | $5,338 | $288 | $5,050 |
| 2023 | $582 | $4,950 | $253 | $4,697 |
| 2022 | $425 | $4,266 | $253 | $4,013 |
| 2021 | $427 | $4,266 | $253 | $4,013 |
| 2020 | $428 | $4,266 | $253 | $4,013 |
| 2019 | $227 | $2,282 | $254 | $2,028 |
| 2018 | $431 | $4,424 | $254 | $4,170 |
| 2017 | $417 | $4,422 | $253 | $4,169 |
| 2016 | $421 | $4,422 | $253 | $4,169 |
| 2015 | $417 | $4,422 | $253 | $4,169 |
| 2014 | $425 | $4,422 | $253 | $4,169 |
Source: Public Records
Map
Nearby Homes