Estimated Value: $415,841 - $481,000
3
Beds
2
Baths
1,501
Sq Ft
$299/Sq Ft
Est. Value
About This Home
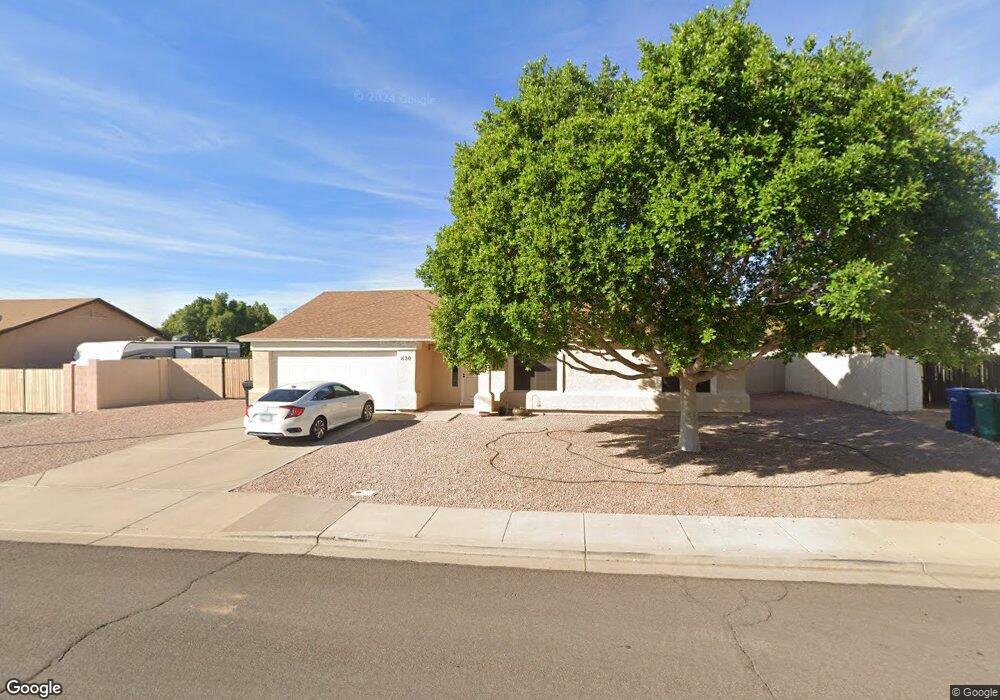
This home is located at 830 N Hillridge, Mesa, AZ 85207 and is currently estimated at $449,460, approximately $299 per square foot. 830 N Hillridge is a home located in Maricopa County with nearby schools including Salk Elementary School, Franklin at Brimhall Elementary School, and Franklin West Elementary School.
Ownership History
Date
Name
Owned For
Owner Type
Purchase Details
Closed on
Aug 9, 2022
Sold by
Cindy Chappell
Bought by
Cindy Chappell Living Trust
Current Estimated Value
Purchase Details
Closed on
Aug 29, 2005
Sold by
Schlitz Gerald and Schlitz Joan S
Bought by
Chappell Cindy
Home Financials for this Owner
Home Financials are based on the most recent Mortgage that was taken out on this home.
Original Mortgage
$151,000
Interest Rate
5.62%
Mortgage Type
Purchase Money Mortgage
Purchase Details
Closed on
Oct 10, 2001
Sold by
Achberger Helen E
Bought by
Schlitz Gerald F and Schlitz Joan S
Purchase Details
Closed on
Jun 27, 1997
Sold by
Providence Homes Inc
Bought by
Davidheiser Edward and Achberger Helen E
Create a Home Valuation Report for This Property
The Home Valuation Report is an in-depth analysis detailing your home's value as well as a comparison with similar homes in the area
Purchase History
| Date | Buyer | Sale Price | Title Company |
|---|---|---|---|
| Cindy Chappell Living Trust | -- | None Listed On Document | |
| Chappell Cindy | $251,000 | Capital Title Agency Inc | |
| Schlitz Gerald F | $127,000 | Fidelity National Title | |
| Davidheiser Edward | $94,644 | Security Title Agency | |
| Providence Homes Inc | $82,813 | Security Title Agency |
Source: Public Records
Mortgage History
| Date | Status | Borrower | Loan Amount |
|---|---|---|---|
| Previous Owner | Chappell Cindy | $151,000 |
Source: Public Records
Tax History
| Year | Tax Paid | Tax Assessment Tax Assessment Total Assessment is a certain percentage of the fair market value that is determined by local assessors to be the total taxable value of land and additions on the property. | Land | Improvement |
|---|---|---|---|---|
| 2025 | $1,428 | $17,177 | -- | -- |
| 2024 | $1,443 | $16,359 | -- | -- |
| 2023 | $1,443 | $33,850 | $6,770 | $27,080 |
| 2022 | $1,412 | $25,330 | $5,060 | $20,270 |
| 2021 | $1,451 | $23,220 | $4,640 | $18,580 |
| 2020 | $1,431 | $21,580 | $4,310 | $17,270 |
| 2019 | $1,326 | $19,850 | $3,970 | $15,880 |
| 2018 | $1,266 | $18,560 | $3,710 | $14,850 |
| 2017 | $1,227 | $16,960 | $3,390 | $13,570 |
| 2016 | $1,205 | $16,470 | $3,290 | $13,180 |
| 2015 | $1,137 | $14,780 | $2,950 | $11,830 |
Source: Public Records
Map
Nearby Homes
- 650 N Hawes Rd Unit 4634
- 650 N Hawes Rd Unit 3516
- 650 N Hawes Rd Unit 3123
- 650 N Hawes Rd Unit 3202
- 650 N Hawes Rd Unit 4414
- 650 N Hawes Rd Unit 3809
- 650 N Hawes Rd Unit 3404
- 650 N Hawes Rd Unit 3606
- 650 N Hawes Rd Unit 5304
- 650 N Hawes Rd Unit 4010
- 650 N Hawes Rd Unit 3321
- 650 N Hawes Rd Unit 4326
- 650 N Hawes Rd Unit 2851
- 650 N Hawes Rd Unit 1900
- 650 N Hawes Rd Unit 4004
- 650 N Hawes Rd Unit 3406
- 650 N Hawes Rd Unit 4507
- 650 N Hawes Rd
- 650 N Hawes Rd Unit 3815
- 650 N Hawes Rd Unit 3504
- 838 N Hillridge
- 822 N Hillridge
- 829 N Lotus Cir
- 837 N Lotus Cir
- 833 N Hillridge
- 825 N Hillridge
- 821 N Lotus Cir
- 846 N Hillridge
- 841 N Hillridge
- 817 N Hillridge
- 845 N Lotus Cir
- 8153 E Ellis St
- 854 N Hillridge Unit II
- 0 N 92nd - Lot#2 St Unit 2
- 0 N 92nd - Lot #1 St Unit 1
- 8137 E Enrose St
- 8141 E Ellis St
- 828 N Lotus Cir
- 8161 E Ellis St
- 836 N Lotus Cir
Your Personal Tour Guide
Ask me questions while you tour the home.