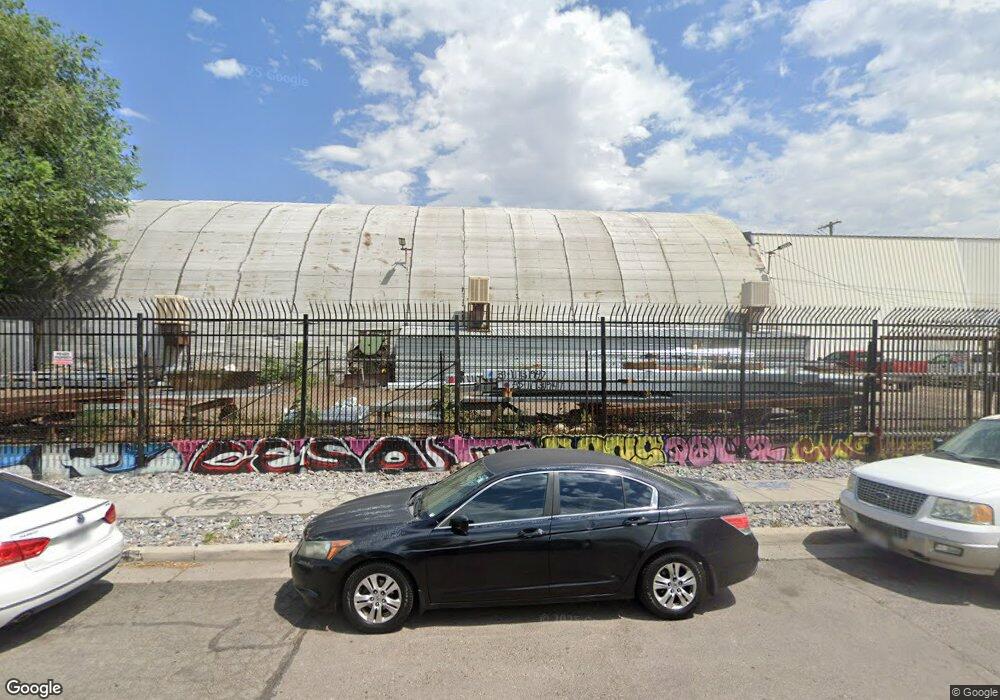
830 S 700 W Salt Lake City, UT 84104
Poplar Grove Neighborhood
--
Bed
--
Bath
19,800
Sq Ft
0.89
Acres
About This Home
This home is located at 830 S 700 W, Salt Lake City, UT 84104. 830 S 700 W is a home located in Salt Lake County with nearby schools including Riley Elementary School, Glendale Middle, and Highland High School.
Ownership History
Date
Name
Owned For
Owner Type
Purchase Details
Closed on
Mar 30, 2022
Sold by
Ashment And Pasillas Llc
Bought by
Elsweyr Properties Llc
Home Financials for this Owner
Home Financials are based on the most recent Mortgage that was taken out on this home.
Original Mortgage
$1,200,000
Outstanding Balance
$1,129,181
Interest Rate
4.42%
Mortgage Type
New Conventional
Purchase Details
Closed on
Jun 4, 2003
Sold by
Star Steel Inc
Bought by
Ashment & Pasillas Llc
Purchase Details
Closed on
Dec 19, 1995
Sold by
Star Steel Inc
Bought by
Ashment and Ashment Pasillas
Create a Home Valuation Report for This Property
The Home Valuation Report is an in-depth analysis detailing your home's value as well as a comparison with similar homes in the area
Home Values in the Area
Average Home Value in this Area
Purchase History
| Date | Buyer | Sale Price | Title Company |
|---|---|---|---|
| Elsweyr Properties Llc | -- | Us Title | |
| Ashment & Pasillas Llc | -- | -- | |
| Ashment | -- | -- |
Source: Public Records
Mortgage History
| Date | Status | Borrower | Loan Amount |
|---|---|---|---|
| Open | Elsweyr Properties Llc | $1,200,000 |
Source: Public Records
Tax History Compared to Growth
Tax History
| Year | Tax Paid | Tax Assessment Tax Assessment Total Assessment is a certain percentage of the fair market value that is determined by local assessors to be the total taxable value of land and additions on the property. | Land | Improvement |
|---|---|---|---|---|
| 2025 | $14,386 | $1,488,300 | $913,500 | $574,800 |
| 2024 | $14,386 | $1,509,700 | $664,300 | $845,400 |
| 2023 | $13,354 | $1,350,800 | $456,700 | $894,100 |
| 2022 | $14,897 | $1,413,800 | $332,100 | $1,081,700 |
| 2021 | $8,356 | $718,000 | $301,000 | $417,000 |
| 2020 | $9,495 | $776,600 | $280,200 | $496,400 |
| 2019 | $7,677 | $590,700 | $269,800 | $320,900 |
| 2018 | $9,163 | $686,600 | $249,100 | $437,500 |
| 2017 | $9,132 | $641,100 | $249,100 | $392,000 |
| 2016 | $7,910 | $527,300 | $236,600 | $290,700 |
| 2015 | $8,288 | $523,700 | $232,500 | $291,200 |
| 2014 | $6,195 | $388,300 | $228,300 | $160,000 |
Source: Public Records
Map
Nearby Homes