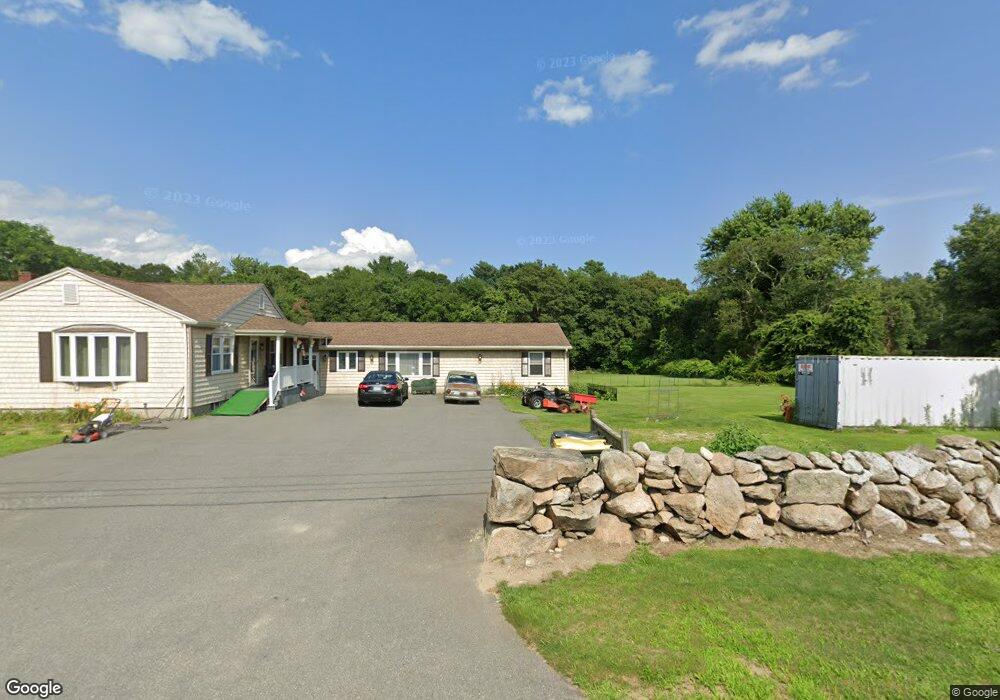
830 Sanford Rd Westport, MA 02790
North Westport NeighborhoodEstimated Value: $458,000 - $574,000
3
Beds
--
Bath
2,127
Sq Ft
$249/Sq Ft
Est. Value
About This Home
This home is located at 830 Sanford Rd, Westport, MA 02790 and is currently estimated at $529,981, approximately $249 per square foot. 830 Sanford Rd is a home located in Bristol County with nearby schools including Alice A. Macomber Primary School, Westport Elementary School, and Westport Middle-High School.
Ownership History
Date
Name
Owned For
Owner Type
Purchase Details
Closed on
Jul 15, 2025
Sold by
Katz Carol A
Bought by
Carol Katz Lt and Katz
Current Estimated Value
Purchase Details
Closed on
Aug 31, 2000
Sold by
Kerns Anne Marie and Briere Doris T
Bought by
Katz Carol A
Create a Home Valuation Report for This Property
The Home Valuation Report is an in-depth analysis detailing your home's value as well as a comparison with similar homes in the area
Home Values in the Area
Average Home Value in this Area
Purchase History
| Date | Buyer | Sale Price | Title Company |
|---|---|---|---|
| Carol Katz Lt | -- | -- | |
| Carol Katz Lt | -- | -- | |
| Carol Katz Lt | -- | -- | |
| Katz Carol A | $168,000 | -- | |
| Katz Carol A | $168,000 | -- |
Source: Public Records
Mortgage History
| Date | Status | Borrower | Loan Amount |
|---|---|---|---|
| Previous Owner | Katz Carol A | $257,000 | |
| Previous Owner | Katz Carol A | $227,900 | |
| Previous Owner | Katz Carol A | $197,000 |
Source: Public Records
Tax History Compared to Growth
Tax History
| Year | Tax Paid | Tax Assessment Tax Assessment Total Assessment is a certain percentage of the fair market value that is determined by local assessors to be the total taxable value of land and additions on the property. | Land | Improvement |
|---|---|---|---|---|
| 2025 | $3,246 | $435,700 | $190,200 | $245,500 |
| 2024 | $3,181 | $411,500 | $169,100 | $242,400 |
| 2023 | $3,096 | $379,400 | $154,200 | $225,200 |
| 2022 | $2,760 | $346,700 | $154,200 | $192,500 |
| 2021 | $2,760 | $320,200 | $127,700 | $192,500 |
| 2020 | $2,657 | $315,200 | $122,700 | $192,500 |
| 2019 | $2,603 | $314,700 | $122,700 | $192,000 |
| 2018 | $2,402 | $294,000 | $120,300 | $173,700 |
| 2017 | $2,291 | $287,400 | $116,500 | $170,900 |
| 2016 | $2,125 | $268,600 | $112,800 | $155,800 |
| 2015 | $2,029 | $255,900 | $115,300 | $140,600 |
Source: Public Records
Map
Nearby Homes