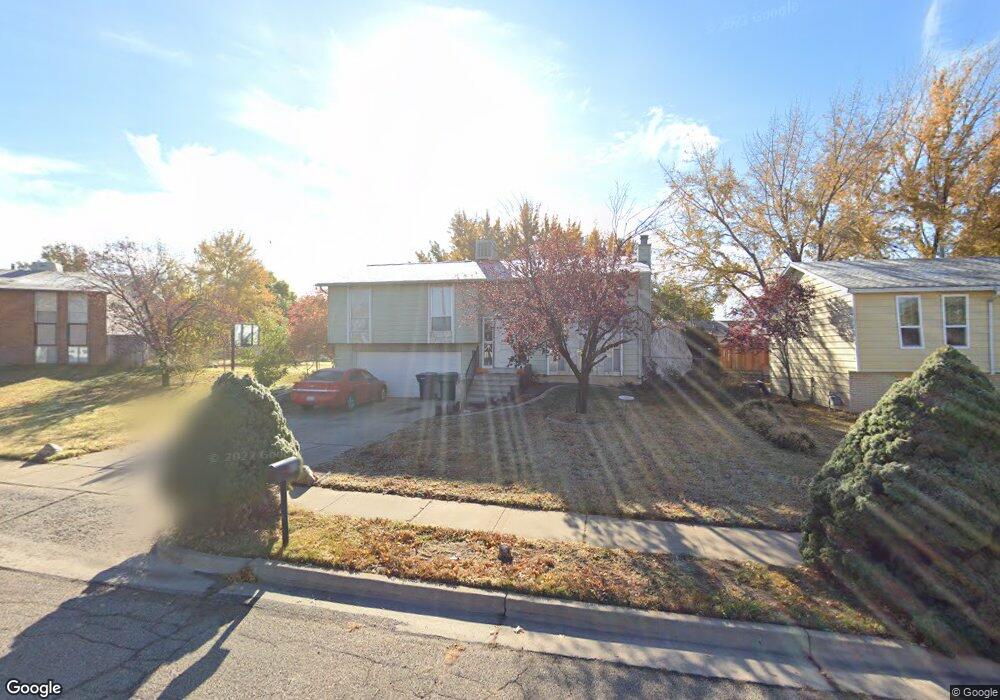
830 W 700 N Clearfield, UT 84015
Estimated Value: $405,000 - $427,000
3
Beds
2
Baths
1,715
Sq Ft
$241/Sq Ft
Est. Value
About This Home
This home is located at 830 W 700 N, Clearfield, UT 84015 and is currently estimated at $413,077, approximately $240 per square foot. 830 W 700 N is a home located in Davis County with nearby schools including Doxey Elementary School, North Davis Junior High School, and Clearfield High School.
Ownership History
Date
Name
Owned For
Owner Type
Purchase Details
Closed on
Aug 10, 2001
Sold by
Hud
Bought by
Wilde Lamar A
Current Estimated Value
Home Financials for this Owner
Home Financials are based on the most recent Mortgage that was taken out on this home.
Original Mortgage
$93,406
Outstanding Balance
$35,892
Interest Rate
7.1%
Estimated Equity
$377,185
Purchase Details
Closed on
Apr 27, 2001
Sold by
Chase Manhattan Mtg Corp
Bought by
Hud
Purchase Details
Closed on
Apr 26, 2001
Sold by
Craig Nicholas and Widdison Marc P
Bought by
Chase Manhattan Mtg Corp
Purchase Details
Closed on
Nov 15, 1999
Sold by
Craig James B and Craig Tina M
Bought by
Craig Nicholas and Widdison Marc P
Home Financials for this Owner
Home Financials are based on the most recent Mortgage that was taken out on this home.
Original Mortgage
$118,817
Interest Rate
7.82%
Mortgage Type
FHA
Create a Home Valuation Report for This Property
The Home Valuation Report is an in-depth analysis detailing your home's value as well as a comparison with similar homes in the area
Home Values in the Area
Average Home Value in this Area
Purchase History
| Date | Buyer | Sale Price | Title Company |
|---|---|---|---|
| Wilde Lamar A | -- | First American Title Insuran | |
| Hud | -- | Backman Stewart Title Servic | |
| Chase Manhattan Mtg Corp | $131,153 | Backman Stewart Title Servic | |
| Craig Nicholas | -- | Founders Title Co |
Source: Public Records
Mortgage History
| Date | Status | Borrower | Loan Amount |
|---|---|---|---|
| Open | Wilde Lamar A | $93,406 | |
| Previous Owner | Craig Nicholas | $118,817 |
Source: Public Records
Tax History
| Year | Tax Paid | Tax Assessment Tax Assessment Total Assessment is a certain percentage of the fair market value that is determined by local assessors to be the total taxable value of land and additions on the property. | Land | Improvement |
|---|---|---|---|---|
| 2025 | $2,283 | $204,600 | $81,130 | $123,470 |
| 2024 | $2,206 | $199,099 | $77,496 | $121,603 |
| 2023 | $2,040 | $185,900 | $67,700 | $118,199 |
| 2022 | $2,124 | $346,000 | $126,567 | $219,433 |
| 2021 | $1,861 | $252,000 | $78,772 | $173,228 |
| 2020 | $1,614 | $217,000 | $67,162 | $149,838 |
| 2019 | $1,567 | $208,000 | $66,829 | $141,171 |
| 2018 | $1,392 | $180,000 | $59,034 | $120,966 |
| 2016 | $1,193 | $80,630 | $24,001 | $56,629 |
| 2015 | $1,150 | $74,140 | $24,001 | $50,139 |
| 2014 | $1,145 | $74,768 | $24,001 | $50,767 |
| 2013 | -- | $66,400 | $26,730 | $39,670 |
Source: Public Records
Map
Nearby Homes
Your Personal Tour Guide
Ask me questions while you tour the home.