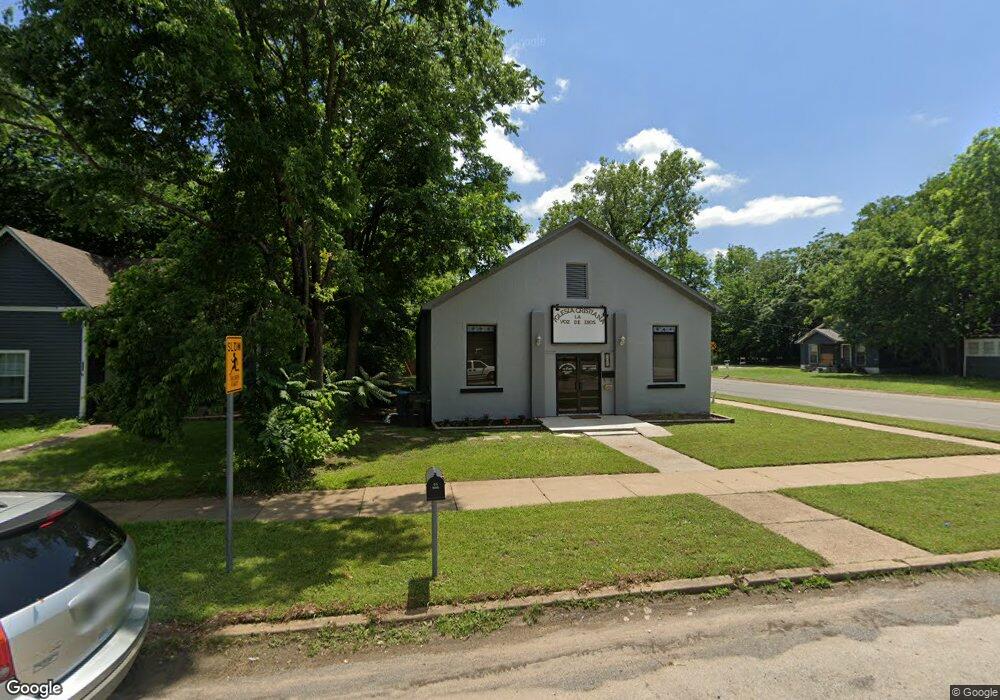
830 W Owing St Denison, TX 75020
Estimated Value: $119,125
--
Bed
--
Bath
1,868
Sq Ft
$64/Sq Ft
Est. Value
About This Home
This home is located at 830 W Owing St, Denison, TX 75020 and is currently estimated at $119,125, approximately $63 per square foot. 830 W Owing St is a home located in Grayson County with nearby schools including Houston Elementary School, Scott Middle School, and Denison High School.
Ownership History
Date
Name
Owned For
Owner Type
Purchase Details
Closed on
Aug 2, 2022
Sold by
Antonio Orellana
Bought by
Jaimez Jose Rene Bonilla
Current Estimated Value
Home Financials for this Owner
Home Financials are based on the most recent Mortgage that was taken out on this home.
Original Mortgage
$100,000
Outstanding Balance
$75,084
Interest Rate
5.81%
Mortgage Type
Seller Take Back
Estimated Equity
$44,041
Purchase Details
Closed on
Apr 19, 2021
Sold by
Musser Wayne M
Bought by
Orellana Antonio
Purchase Details
Closed on
Mar 26, 2004
Sold by
Knight Marvin
Bought by
Musser Wayne M
Home Financials for this Owner
Home Financials are based on the most recent Mortgage that was taken out on this home.
Original Mortgage
$30,720
Interest Rate
5.59%
Mortgage Type
Commercial
Create a Home Valuation Report for This Property
The Home Valuation Report is an in-depth analysis detailing your home's value as well as a comparison with similar homes in the area
Home Values in the Area
Average Home Value in this Area
Purchase History
| Date | Buyer | Sale Price | Title Company |
|---|---|---|---|
| Jaimez Jose Rene Bonilla | -- | Red River Title | |
| Orellana Antonio | -- | None Available | |
| Musser Wayne M | -- | Grayson County Title Company |
Source: Public Records
Mortgage History
| Date | Status | Borrower | Loan Amount |
|---|---|---|---|
| Open | Jaimez Jose Rene Bonilla | $100,000 | |
| Previous Owner | Musser Wayne M | $30,720 |
Source: Public Records
Tax History Compared to Growth
Tax History
| Year | Tax Paid | Tax Assessment Tax Assessment Total Assessment is a certain percentage of the fair market value that is determined by local assessors to be the total taxable value of land and additions on the property. | Land | Improvement |
|---|---|---|---|---|
| 2025 | $2,971 | $127,894 | $30,375 | $97,519 |
| 2024 | $2,971 | $127,894 | $29,250 | $98,644 |
| 2023 | $2,898 | $127,894 | $24,750 | $103,144 |
| 2022 | $1,837 | $77,305 | $24,750 | $52,555 |
| 2021 | $1,950 | $77,305 | $12,375 | $64,930 |
| 2020 | $1,608 | $60,943 | $12,375 | $48,568 |
| 2019 | $1,605 | $58,325 | $9,900 | $48,425 |
| 2018 | $1,618 | $58,325 | $7,560 | $50,765 |
| 2017 | $1,390 | $49,690 | $7,560 | $42,130 |
| 2016 | $1,390 | $49,690 | $7,560 | $42,130 |
| 2015 | $1,070 | $37,895 | $7,560 | $30,335 |
| 2014 | $1,020 | $36,118 | $7,560 | $28,558 |
Source: Public Records
Map
Nearby Homes
- 831 W Owing St
- 826 W Crawford St
- 920 W Morgan St
- 1027 W Crawford St
- 705 W Crawford St
- TBD W Main St
- 830 W Shepherd St
- 1109 W Crawford St
- 1120 W Owing St
- 904 W Shepherd St
- 1127 W Morgan St
- 609 W Owing St
- 618 W Chestnut St
- 919 W Day St
- 627 W Chestnut St
- 1131 W Shepherd St
- 702 S Barrett Ave
- 1223 W Owing St
- 811 W Woodard St
- 1217 W Nelson St
- 826 W Owing St
- 820 W Owing St
- 900 W Owings St
- 831 W Morgan St
- 900 W Owing St
- 825 W Morgan St
- 823 W Morgan St
- 827 W Owing St
- 812 W Owing St
- 819 W Morgan St
- 825 W Owing St
- 901 W Owings St
- 819 W Owings St
- 907 W Owings St
- 908 W Owing St
- 817 W Owings St
- 819 W Owing St
- 808 W Owing St
- 817 W Owing St
- 811 W Morgan St