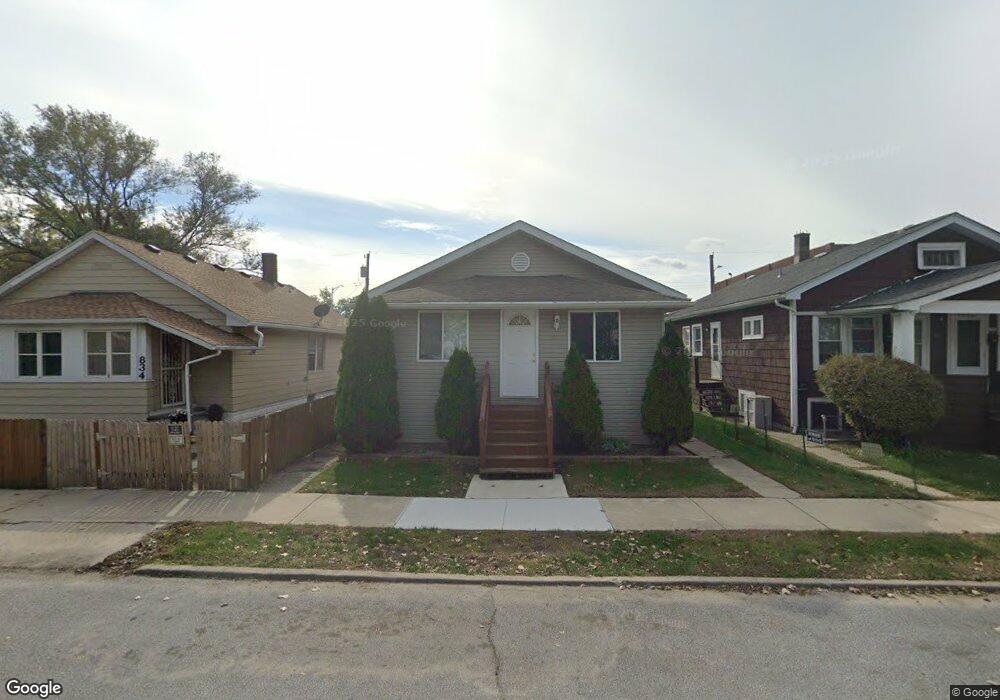
830 Wilcox St Hammond, IN 46320
Estimated Value: $133,000 - $254,000
2
Beds
2
Baths
1,040
Sq Ft
$176/Sq Ft
Est. Value
About This Home
This home is located at 830 Wilcox St, Hammond, IN 46320 and is currently estimated at $182,567, approximately $175 per square foot. 830 Wilcox St is a home located in Lake County with nearby schools including Eggers Middle School, Hammond High School, and Hammond Academy Of Science & Tech.
Ownership History
Date
Name
Owned For
Owner Type
Purchase Details
Closed on
Aug 29, 2024
Sold by
Region Renovations Inc
Bought by
Krbi Investments Llc
Current Estimated Value
Home Financials for this Owner
Home Financials are based on the most recent Mortgage that was taken out on this home.
Original Mortgage
$695,000
Outstanding Balance
$685,049
Interest Rate
6.77%
Mortgage Type
New Conventional
Estimated Equity
-$502,482
Purchase Details
Closed on
Aug 3, 2007
Sold by
Pazour Kevin M and Pazour Karen M
Bought by
Region Renovations Inc
Create a Home Valuation Report for This Property
The Home Valuation Report is an in-depth analysis detailing your home's value as well as a comparison with similar homes in the area
Home Values in the Area
Average Home Value in this Area
Purchase History
| Date | Buyer | Sale Price | Title Company |
|---|---|---|---|
| Krbi Investments Llc | -- | Meridian Title | |
| Region Renovations Inc | -- | Metropolitan Title |
Source: Public Records
Mortgage History
| Date | Status | Borrower | Loan Amount |
|---|---|---|---|
| Open | Krbi Investments Llc | $695,000 |
Source: Public Records
Tax History
| Year | Tax Paid | Tax Assessment Tax Assessment Total Assessment is a certain percentage of the fair market value that is determined by local assessors to be the total taxable value of land and additions on the property. | Land | Improvement |
|---|---|---|---|---|
| 2025 | $3,074 | $137,100 | $14,900 | $122,200 |
| 2024 | $5,305 | $118,300 | $14,900 | $103,400 |
| 2023 | $2,803 | $111,000 | $15,200 | $95,800 |
| 2022 | $2,803 | $104,600 | $15,200 | $89,400 |
| 2021 | $1,927 | $71,100 | $7,600 | $63,500 |
| 2020 | $1,796 | $65,800 | $7,600 | $58,200 |
| 2019 | $1,802 | $61,800 | $7,600 | $54,200 |
| 2018 | $2,005 | $63,500 | $7,600 | $55,900 |
| 2017 | $2,136 | $59,000 | $7,600 | $51,400 |
| 2016 | $1,962 | $62,800 | $7,600 | $55,200 |
| 2014 | $2,089 | $66,700 | $7,600 | $59,100 |
| 2013 | $2,058 | $69,400 | $7,600 | $61,800 |
Source: Public Records
Map
Nearby Homes
- 861 Wilcox St
- 851 150th St
- 713 Sibley St
- 1111 Truman St
- 4911 Pine Ave
- 4921 Ash Ave
- 4828 Oak Ave
- 5545 Claude Ave
- 5411 Columbia Ave
- 922 Summer St
- 4763 Calumet Ave
- 1119 Sibley St
- 4747 Cedar Ave
- 5631 Alice St
- 4648 Torrence Ave
- 4643-45 Johnson Ave
- 4337-39 Oak Ave
- 830 Becker St
- 5819 Erie Ave
- 929 Drackert St
Your Personal Tour Guide
Ask me questions while you tour the home.