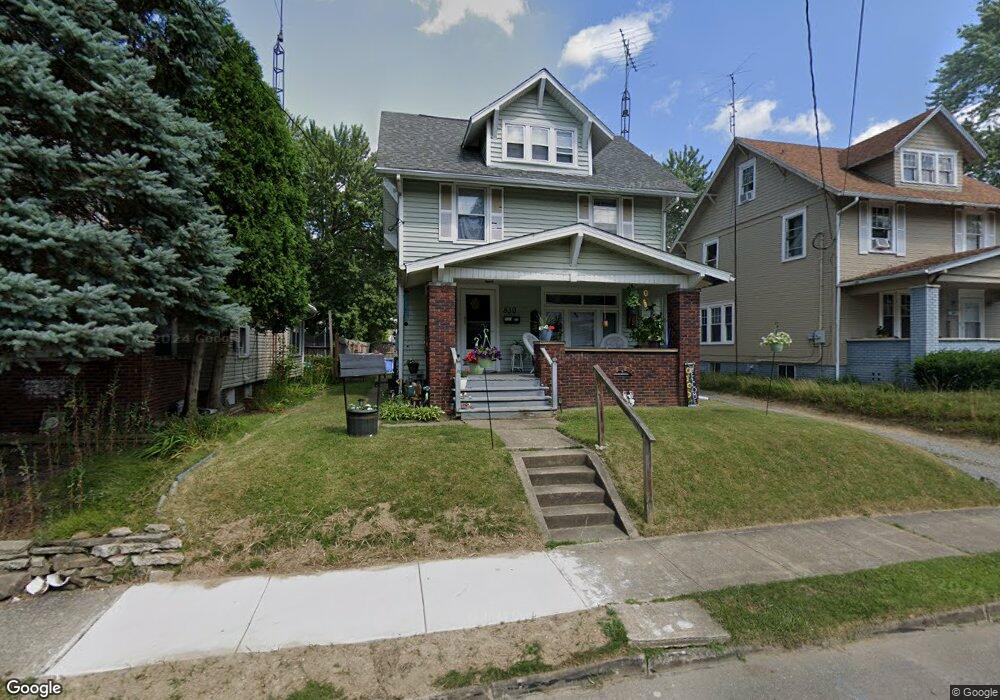
830 Wright Ave Alliance, OH 44601
Estimated Value: $78,000 - $107,000
3
Beds
1
Bath
1,264
Sq Ft
$71/Sq Ft
Est. Value
About This Home
This home is located at 830 Wright Ave, Alliance, OH 44601 and is currently estimated at $89,671, approximately $70 per square foot. 830 Wright Ave is a home located in Stark County with nearby schools including Alliance Early Learning School, Alliance Intermediate School at Northside, and Alliance Middle School.
Ownership History
Date
Name
Owned For
Owner Type
Purchase Details
Closed on
Dec 18, 2007
Sold by
Sherrys Treasures Llc
Bought by
Victory Shoe Shine Llc
Current Estimated Value
Purchase Details
Closed on
Mar 17, 2005
Sold by
Hustus Nicholas and Hustus Sherry A
Bought by
Sherrys Treasures Llc
Purchase Details
Closed on
Dec 19, 2001
Sold by
Beneficial Ohio Inc
Bought by
Hustus Nicholas L and Hustus Sherry A
Home Financials for this Owner
Home Financials are based on the most recent Mortgage that was taken out on this home.
Original Mortgage
$47,700
Interest Rate
6.92%
Mortgage Type
Purchase Money Mortgage
Purchase Details
Closed on
Apr 25, 2001
Sold by
Long Unknown Heirs Devisees James J
Bought by
Beneficial Ohio Inc and Beneficial Mtg Co Of Ohio
Purchase Details
Closed on
Apr 17, 2001
Sold by
Unknown Heirs Devisees Of James J Long J
Bought by
Beneficial Ohio Inc and Beneficial Mtg Co Of Ohio
Create a Home Valuation Report for This Property
The Home Valuation Report is an in-depth analysis detailing your home's value as well as a comparison with similar homes in the area
Home Values in the Area
Average Home Value in this Area
Purchase History
| Date | Buyer | Sale Price | Title Company |
|---|---|---|---|
| Victory Shoe Shine Llc | -- | Attorney | |
| Sherrys Treasures Llc | -- | -- | |
| Hustus Nicholas L | $53,000 | -- | |
| Beneficial Ohio Inc | $38,600 | Stewart Title Guaranty Compa | |
| Beneficial Ohio Inc | $38,600 | -- |
Source: Public Records
Mortgage History
| Date | Status | Borrower | Loan Amount |
|---|---|---|---|
| Previous Owner | Hustus Nicholas L | $47,700 |
Source: Public Records
Tax History
| Year | Tax Paid | Tax Assessment Tax Assessment Total Assessment is a certain percentage of the fair market value that is determined by local assessors to be the total taxable value of land and additions on the property. | Land | Improvement |
|---|---|---|---|---|
| 2025 | -- | $21,640 | $5,710 | $15,930 |
| 2024 | -- | $21,640 | $5,710 | $15,930 |
| 2023 | $725 | $17,610 | $5,360 | $12,250 |
| 2022 | $437 | $17,610 | $5,360 | $12,250 |
| 2021 | $454 | $17,610 | $5,360 | $12,250 |
| 2020 | $662 | $14,880 | $4,660 | $10,220 |
| 2019 | $125 | $14,880 | $4,660 | $10,220 |
Source: Public Records
Map
Nearby Homes
- 621 S Haines Ave
- 203 Glamorgan St
- 233 W Cambridge St
- 228 W Oxford St
- 535 S Mckinley Ave
- 807 S Union Ave
- 479 W High St
- 46 Rosenberry St
- 427 S Union Ave
- 343 W Columbia St
- 264 W Market St
- 118 S Mckinley Ave
- 134 11th St
- 33 S Lincoln Ave
- 163 W Market St
- 234 Rosenberry St
- 226 Milner St
- 1044 Glamorgan St
- 231 Rosenberry St
- 167 11th St
- 822 Wright Ave
- 812 Wright Ave
- 846 Wright Ave
- 829 S Haines Ave
- 837 S Haines Ave
- 815 S Haines Ave
- 332 W Grant St
- 854 Wright Ave
- 847 S Haines Ave
- 829 Wright Ave
- 837 Wright Ave
- 821 Wright Ave
- 803 S Haines Ave
- 811 Wright Ave
- 864 Wright Ave
- 855 Wright Ave
- 803 Wright Ave
- 863 S Haines Ave
- 863 S Haines Ave
- 784 Wright Ave
Your Personal Tour Guide
Ask me questions while you tour the home.