Estimated Value: $276,000 - $1,682,000
--
Bed
2
Baths
2,385
Sq Ft
$282/Sq Ft
Est. Value
About This Home
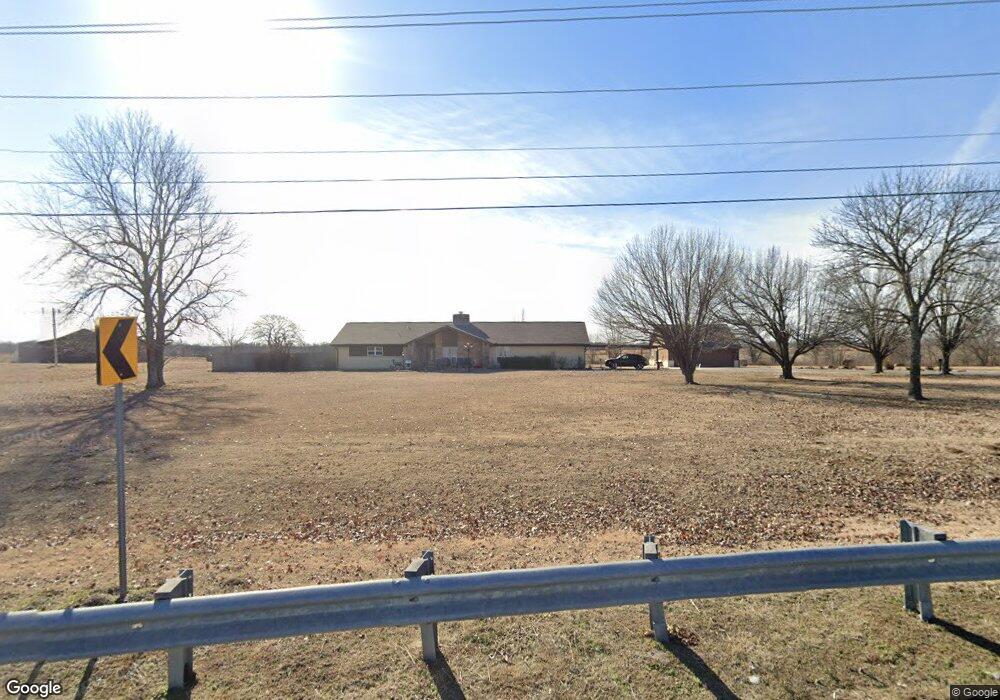
This home is located at 8300 E 181st St S, Bixby, OK 74008 and is currently estimated at $673,309, approximately $282 per square foot. 8300 E 181st St S is a home located in Tulsa County with nearby schools including Liberty Elementary School, Liberty Junior High School, and Liberty High School.
Ownership History
Date
Name
Owned For
Owner Type
Purchase Details
Closed on
Jul 5, 2001
Sold by
Ketchum Jim G and Ketchum Wanda M
Bought by
Livin Jim and Livin Wanda
Current Estimated Value
Create a Home Valuation Report for This Property
The Home Valuation Report is an in-depth analysis detailing your home's value as well as a comparison with similar homes in the area
Home Values in the Area
Average Home Value in this Area
Purchase History
| Date | Buyer | Sale Price | Title Company |
|---|---|---|---|
| Livin Jim | -- | -- |
Source: Public Records
Tax History Compared to Growth
Tax History
| Year | Tax Paid | Tax Assessment Tax Assessment Total Assessment is a certain percentage of the fair market value that is determined by local assessors to be the total taxable value of land and additions on the property. | Land | Improvement |
|---|---|---|---|---|
| 2024 | $1,345 | $12,337 | $52 | $12,285 |
| 2023 | $1,345 | $13,337 | $56 | $13,281 |
| 2022 | $1,301 | $12,337 | $52 | $12,285 |
| 2021 | $1,325 | $12,337 | $52 | $12,285 |
| 2020 | $1,327 | $12,337 | $52 | $12,285 |
| 2019 | $1,184 | $12,337 | $52 | $12,285 |
| 2018 | $1,370 | $12,337 | $52 | $12,285 |
| 2017 | $1,360 | $13,338 | $61 | $13,277 |
| 2016 | $1,359 | $13,338 | $61 | $13,277 |
| 2015 | $1,322 | $13,338 | $61 | $13,277 |
| 2014 | $1,325 | $13,338 | $61 | $13,277 |
Source: Public Records
Map
Nearby Homes
- 0001 E 181st St S
- 0002 E 181st St S
- 18225 S 79th East Ave
- 18241 S 79th Ave E
- 18070 S 72nd East Ave
- 6710 E 181st St S
- 17524 S 71st East Ave
- 17470 S 92nd East Ave
- 5336 E 175th St S
- 5514 E 175th St S
- 5304 E 175th St S
- 17816 S 47th East Ave
- 17829 S 47th East Ave
- 4724 E 177th Place S
- 17019 S Memorial Dr
- 4705 E 171st St S
- 5503 E 175th St S
- 8515 E 169th St S
- 9608 E 175th St S
- 16432 S 85th Ave E
- 8027 E 181st St S
- 8208 E 181st St S
- 8120 E 181st St S
- 17972 S Memorial Dr
- 8110 E 181st St S
- 7721 E 181st St S
- 7729 E 181st St S
- 0 181st Ave Unit 1816133
- 17930 S Memorial Dr
- 7950 E 181st St S
- 17904 S Memorial Dr
- 17850 S Memorial Dr
- 7613 E 181st St S
- 7601 E 181st St S
- 18225 S 79th Ave E
- 18380 S Memorial Dr
- 7505 E 181st St S
- 18144 S 79th East Ave
- 18156 S 79th East Ave
- 18206 S 79th East Ave