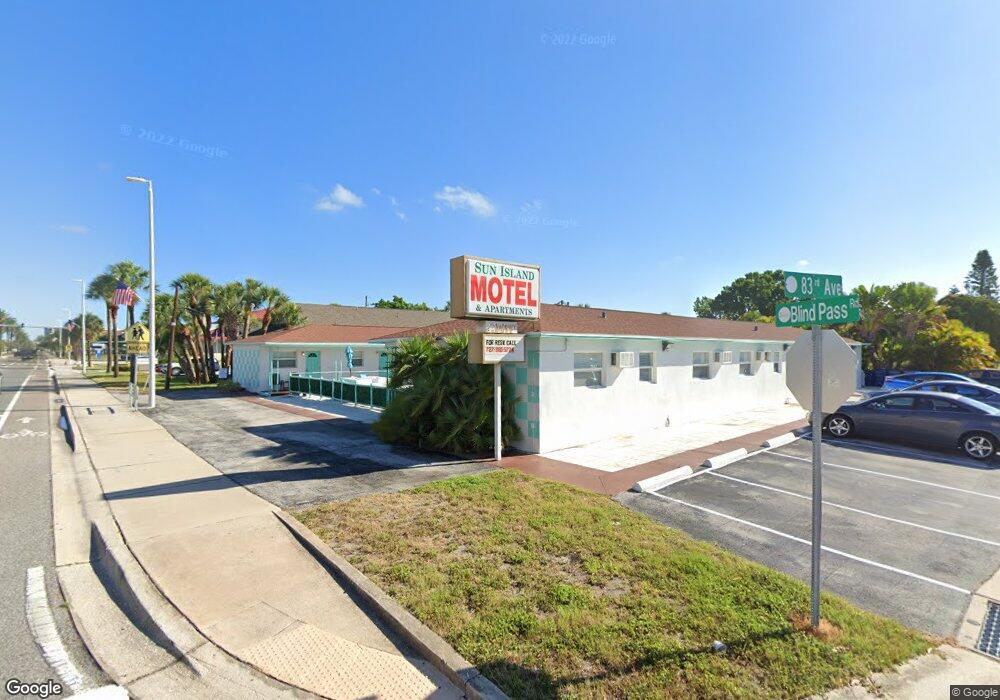
8301 Blind Pass Rd Unit 12 Saint Pete Beach, FL 33706
Estimated Value: $1,656,791
--
Bed
12
Baths
4,450
Sq Ft
$372/Sq Ft
Est. Value
About This Home
This home is located at 8301 Blind Pass Rd Unit 12, Saint Pete Beach, FL 33706 and is currently estimated at $1,656,791, approximately $372 per square foot. 8301 Blind Pass Rd Unit 12 is a home located in Pinellas County with nearby schools including Azalea Elementary School, Azalea Middle School, and Boca Ciega High School.
Ownership History
Date
Name
Owned For
Owner Type
Purchase Details
Closed on
Sep 22, 2025
Sold by
Most Investments Llc and Most Investments 2 Llc
Bought by
Abuhalimeh Enterprises Llc
Current Estimated Value
Purchase Details
Closed on
Aug 13, 2021
Sold by
Tb Hospitality Ventures Llc
Bought by
Most Investments 2 Llc and Most Investments Llc
Home Financials for this Owner
Home Financials are based on the most recent Mortgage that was taken out on this home.
Original Mortgage
$734,358
Interest Rate
2.8%
Mortgage Type
Credit Line Revolving
Purchase Details
Closed on
Dec 29, 2017
Sold by
Bui Thang P
Bought by
Tb Hospitality Ventures Llc
Home Financials for this Owner
Home Financials are based on the most recent Mortgage that was taken out on this home.
Original Mortgage
$1,549,000
Interest Rate
3.9%
Mortgage Type
Commercial
Create a Home Valuation Report for This Property
The Home Valuation Report is an in-depth analysis detailing your home's value as well as a comparison with similar homes in the area
Home Values in the Area
Average Home Value in this Area
Purchase History
| Date | Buyer | Sale Price | Title Company |
|---|---|---|---|
| Abuhalimeh Enterprises Llc | $1,100,000 | International Title Partners | |
| Most Investments 2 Llc | $1,500,000 | Compass Land & Title Llc | |
| Tb Hospitality Ventures Llc | $950,000 | Hillsborough Title Inc |
Source: Public Records
Mortgage History
| Date | Status | Borrower | Loan Amount |
|---|---|---|---|
| Previous Owner | Most Investments 2 Llc | $734,358 | |
| Previous Owner | Most Investments 2 Llc | $734,358 | |
| Previous Owner | Tb Hospitality Ventures Llc | $1,549,000 |
Source: Public Records
Tax History Compared to Growth
Tax History
| Year | Tax Paid | Tax Assessment Tax Assessment Total Assessment is a certain percentage of the fair market value that is determined by local assessors to be the total taxable value of land and additions on the property. | Land | Improvement |
|---|---|---|---|---|
| 2024 | $21,619 | $1,625,000 | $903,794 | $721,206 |
| 2023 | $21,619 | $1,320,000 | $724,683 | $595,317 |
| 2022 | $21,134 | $1,275,000 | $625,260 | $649,740 |
| 2021 | $12,422 | $690,000 | $0 | $0 |
| 2020 | $14,595 | $810,000 | $0 | $0 |
| 2019 | $15,593 | $860,000 | $388,120 | $471,880 |
| 2018 | $14,789 | $810,000 | $0 | $0 |
| 2017 | $5,743 | $361,737 | $0 | $0 |
| 2016 | $4,988 | $286,556 | $0 | $0 |
| 2015 | $4,602 | $265,000 | $0 | $0 |
| 2014 | $4,568 | $267,190 | $0 | $0 |
Source: Public Records
Map
Nearby Homes
- 315 82nd Ave
- 406 86th Ave
- 414 86th Ave
- 450 81st Ave
- 453 85th Ave
- 8635 Boca Ciega Dr
- 8075 Gulf Blvd
- 436 87th Ave
- 411 87th Ave
- 460 87th Ave
- 447 80th Ave
- 8701 Blind Pass Rd Unit 306B
- 340 79th Ave
- 7922 Sailboat Key Blvd S Unit 608
- 7840 Boca Ciega Dr
- 429 88th Ave
- 7810 Boca Ciega Dr
- 8080 Coquina Way
- 440 89th Ave
- 625 80th Ave