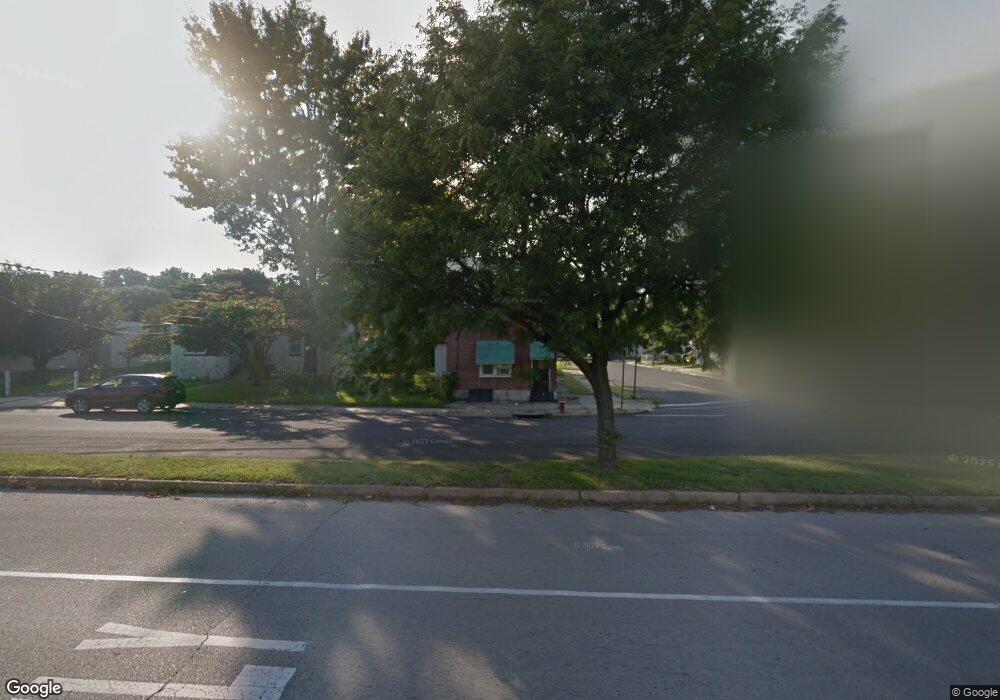
8301 Lindbergh Blvd Philadelphia, PA 19153
Eastwick NeighborhoodEstimated Value: $258,000 - $356,000
4
Beds
2
Baths
1,800
Sq Ft
$171/Sq Ft
Est. Value
About This Home
This home is located at 8301 Lindbergh Blvd, Philadelphia, PA 19153 and is currently estimated at $307,871, approximately $171 per square foot. 8301 Lindbergh Blvd is a home located in Philadelphia County with nearby schools including Penrose School, John Bartram High School, and Philadelphia Montessori Charter School.
Ownership History
Date
Name
Owned For
Owner Type
Purchase Details
Closed on
Jan 30, 2018
Sold by
Zhao Zhi Quiang
Bought by
Lin Jianwei and Lin Soenling
Current Estimated Value
Home Financials for this Owner
Home Financials are based on the most recent Mortgage that was taken out on this home.
Original Mortgage
$97,500
Outstanding Balance
$54,280
Interest Rate
3.94%
Mortgage Type
New Conventional
Estimated Equity
$253,591
Purchase Details
Closed on
Nov 8, 2006
Sold by
Hud
Bought by
Zhao Zhi Quiang
Purchase Details
Closed on
Aug 1, 2005
Sold by
Citimortgage Inc
Bought by
Hud
Purchase Details
Closed on
May 2, 2005
Sold by
Steele Sharleen and Principal Residential Mortgage
Bought by
Citimortgage Inc
Purchase Details
Closed on
Mar 3, 2000
Sold by
Morris Lornell
Bought by
Steele Sharleen
Home Financials for this Owner
Home Financials are based on the most recent Mortgage that was taken out on this home.
Original Mortgage
$64,417
Interest Rate
8.1%
Mortgage Type
FHA
Create a Home Valuation Report for This Property
The Home Valuation Report is an in-depth analysis detailing your home's value as well as a comparison with similar homes in the area
Home Values in the Area
Average Home Value in this Area
Purchase History
| Date | Buyer | Sale Price | Title Company |
|---|---|---|---|
| Lin Jianwei | $130,000 | Alpert Abstract Llc | |
| Zhao Zhi Quiang | $103,888 | None Available | |
| Hud | -- | -- | |
| Citimortgage Inc | $30,000 | -- | |
| Steele Sharleen | $70,000 | -- |
Source: Public Records
Mortgage History
| Date | Status | Borrower | Loan Amount |
|---|---|---|---|
| Open | Lin Jianwei | $97,500 | |
| Previous Owner | Steele Sharleen | $64,417 |
Source: Public Records
Tax History Compared to Growth
Tax History
| Year | Tax Paid | Tax Assessment Tax Assessment Total Assessment is a certain percentage of the fair market value that is determined by local assessors to be the total taxable value of land and additions on the property. | Land | Improvement |
|---|---|---|---|---|
| 2026 | $4,808 | $334,400 | $66,800 | $267,600 |
| 2025 | $4,808 | $334,400 | $66,800 | $267,600 |
| 2024 | $4,808 | $334,400 | $66,800 | $267,600 |
| 2023 | $4,808 | $343,500 | $68,700 | $274,800 |
| 2022 | $3,047 | $343,500 | $68,700 | $274,800 |
| 2021 | $3,094 | $0 | $0 | $0 |
| 2020 | $3,094 | $0 | $0 | $0 |
| 2019 | $2,028 | $0 | $0 | $0 |
| 2018 | $2,186 | $0 | $0 | $0 |
| 2017 | $2,186 | $0 | $0 | $0 |
| 2016 | $2,186 | $0 | $0 | $0 |
| 2015 | $2,093 | $0 | $0 | $0 |
| 2014 | -- | $156,200 | $52,896 | $103,304 |
| 2012 | -- | $12,704 | $3,826 | $8,878 |
Source: Public Records
Map
Nearby Homes
- 8210 Buist Ave
- 8027 Pompey Place
- 8029 Lindbergh Blvd
- 8504 Gibson Place
- 2712 Phillips Terrace
- 8038 Brunswick Ave
- 8025 Brunswick Ave
- 7831 Venus Place
- 631 Tribet Place
- 8514 Luther Place
- 732 Bonsall Ave
- 1009 Laurel Rd
- 2504 S 76th St
- 917 Pine Rd
- 930 Pine Rd
- 2426 S Rosella St
- 420 S 2nd St
- 765 Academy Terrace
- 7429 Tanager St
- 1526 Clifton Ave
- 8305 Lindbergh Blvd Unit 7
- 8235 Lindbergh Blvd
- 2615 S 83rd St
- 8316 Chelwynde Ave
- 2613 S 83rd St
- 8321 Lindbergh Blvd
- 8318 Chelwynde Ave
- 2611 S 83rd St
- 2609 S 83rd St
- 8320-22 Chelwynde Ave
- 8320 Chelwynde Ave Unit 22
- 2607 S 83rd St
- 8225 Lindbergh Blvd
- 8309 Chelwynde Ave Unit 11
- 2605 S 83rd St
- 8313 Chelwynde Ave
- 2603 S 83rd St
- 8315 Chelwynde Ave
- 8217 Lindbergh Blvd Unit 19
- 8222 Chelwynde Ave