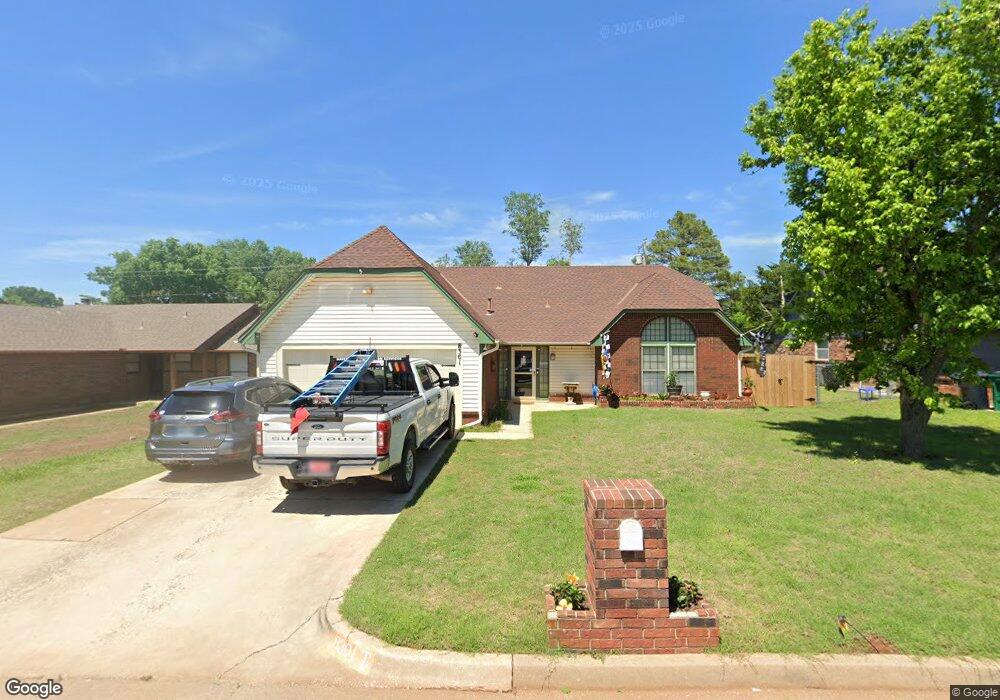
8301 SW 36th St Oklahoma City, OK 73179
Winds West NeighborhoodEstimated Value: $206,920 - $227,000
3
Beds
2
Baths
1,542
Sq Ft
$142/Sq Ft
Est. Value
About This Home
This home is located at 8301 SW 36th St, Oklahoma City, OK 73179 and is currently estimated at $218,980, approximately $142 per square foot. 8301 SW 36th St is a home located in Oklahoma County with nearby schools including Winds West Elementary School, Western Heights Middle School, and Western Heights High School.
Ownership History
Date
Name
Owned For
Owner Type
Purchase Details
Closed on
Sep 16, 2011
Sold by
Pryor Enterprises Inc
Bought by
Davis Joseph Thomas
Current Estimated Value
Purchase Details
Closed on
Apr 27, 2011
Sold by
Secretary Of Housing & Urban Development
Bought by
Pryor Enterprises Inc
Purchase Details
Closed on
Jul 26, 2010
Sold by
Brooks Amy J and Bac Home Loans Servicing L P
Bought by
Secretary Of Housing & Urban Development
Purchase Details
Closed on
Jul 30, 2007
Sold by
Floyd Franklin D and Floyd Rita M
Bought by
Brooks Amy J
Home Financials for this Owner
Home Financials are based on the most recent Mortgage that was taken out on this home.
Original Mortgage
$122,820
Interest Rate
6.69%
Mortgage Type
FHA
Purchase Details
Closed on
May 2, 2001
Sold by
Floyd Franklin D and Floyd Rita M
Bought by
Floyd Franklin D and Floyd Rita M
Create a Home Valuation Report for This Property
The Home Valuation Report is an in-depth analysis detailing your home's value as well as a comparison with similar homes in the area
Home Values in the Area
Average Home Value in this Area
Purchase History
| Date | Buyer | Sale Price | Title Company |
|---|---|---|---|
| Davis Joseph Thomas | $108,000 | American Eagle Title Group | |
| Pryor Enterprises Inc | -- | Heartland Title & Closing Ll | |
| Secretary Of Housing & Urban Development | -- | First American Title | |
| Brooks Amy J | $124,000 | American Guaranty Title Co | |
| Floyd Franklin D | -- | -- |
Source: Public Records
Mortgage History
| Date | Status | Borrower | Loan Amount |
|---|---|---|---|
| Previous Owner | Brooks Amy J | $122,820 |
Source: Public Records
Tax History Compared to Growth
Tax History
| Year | Tax Paid | Tax Assessment Tax Assessment Total Assessment is a certain percentage of the fair market value that is determined by local assessors to be the total taxable value of land and additions on the property. | Land | Improvement |
|---|---|---|---|---|
| 2024 | $1,659 | $15,722 | $2,683 | $13,039 |
| 2023 | $1,659 | $15,264 | $2,883 | $12,381 |
| 2022 | $1,626 | $14,820 | $3,103 | $11,717 |
| 2021 | $1,617 | $14,389 | $3,166 | $11,223 |
| 2020 | $1,517 | $13,970 | $3,376 | $10,594 |
| 2019 | $1,518 | $13,822 | $3,289 | $10,533 |
| 2018 | $1,481 | $13,420 | $0 | $0 |
| 2017 | $1,449 | $13,192 | $3,085 | $10,107 |
| 2016 | $1,390 | $12,807 | $3,033 | $9,774 |
| 2015 | $1,357 | $12,434 | $2,985 | $9,449 |
| 2014 | $1,305 | $12,072 | $3,023 | $9,049 |
Source: Public Records
Map
Nearby Homes
- 3712 Summerwind Ave
- 3716 Western Heights Ave
- 3845 Southwind Ave
- 8508 SW 36th St
- 3325 S Lightner Ln
- 3744 Windswest Ct
- 3817 Windswest Ct
- 8609 SW 36 Terrace
- 8612 SW 36th Terrace
- 8701 SW 37th St
- 9320 SW 34th St
- 4420 Idyl Breeze Dr
- 4400 Wind Haven Dr
- 5 Acres County Line Rd & Sw 44th
- 8808 SW 41 St
- 8520 SW 44th Ct
- 3901 Brougham Way
- 8820 SW 31st Terrace
- 3916 Brougham Way
- 8900 SW 31st Terrace
- 8305 SW 36th St
- 8221 SW 36th St
- 8221 SW 36th St Unit 5802784095
- 8309 SW 36th St
- 8217 SW 36th St
- 3700 Summerwind Ave
- 3701 Southwind Ct
- 8313 SW 36th St
- 8213 SW 36th St
- 3704 Summerwind Ave
- 3701 Summerwind Ave
- 3705 Southwind Ct
- 8317 SW 36th St
- 8209 SW 36th St
- 3705 Summerwind Ave
- 3708 Summerwind Ave
- 3709 Southwind Ct
- 3700 Southwind Ct
- 3624 S Lightner Ln
- 3700 Summerwind Ct