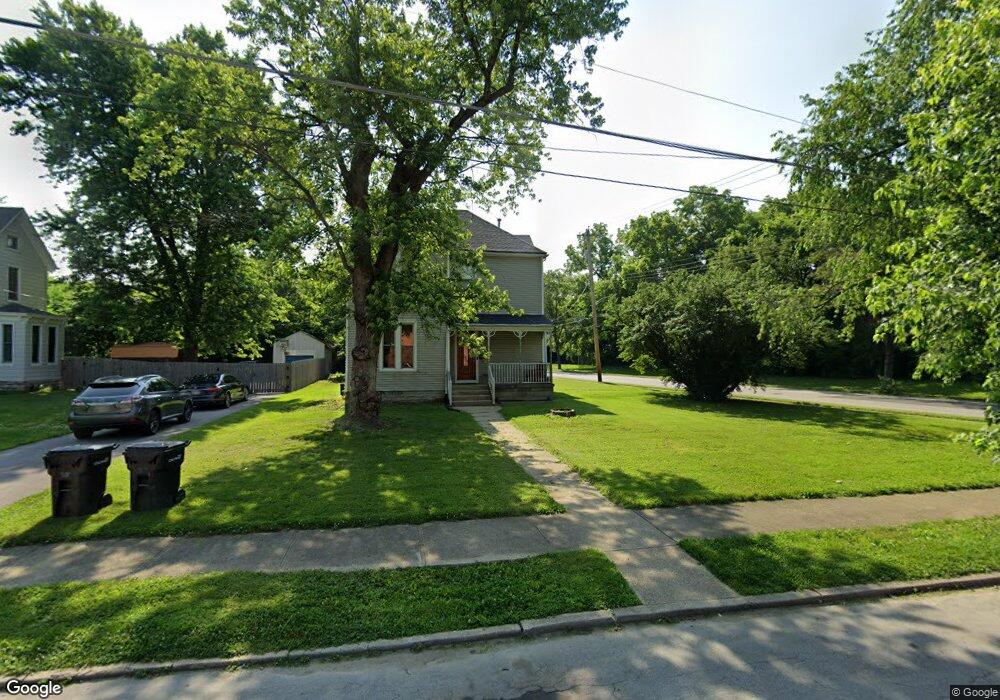
8302 Curzon Ave Cincinnati, OH 45216
Hartwell NeighborhoodEstimated Value: $171,018 - $254,000
3
Beds
2
Baths
1,664
Sq Ft
$130/Sq Ft
Est. Value
About This Home
This home is located at 8302 Curzon Ave, Cincinnati, OH 45216 and is currently estimated at $215,755, approximately $129 per square foot. 8302 Curzon Ave is a home located in Hamilton County with nearby schools including Rising Stars at Carthage, Hartwell School, and Shroder High School.
Ownership History
Date
Name
Owned For
Owner Type
Purchase Details
Closed on
Sep 30, 2020
Sold by
Oli Joint Ventures Llc
Bought by
Oli Delaware Llc
Current Estimated Value
Purchase Details
Closed on
Mar 28, 2018
Sold by
Penklor Properties Llc
Bought by
Oli Joint Ventures Llc
Home Financials for this Owner
Home Financials are based on the most recent Mortgage that was taken out on this home.
Original Mortgage
$3,000,000
Interest Rate
4.38%
Mortgage Type
Commercial
Purchase Details
Closed on
Nov 9, 2009
Sold by
Tristate Holdings Inc
Bought by
Penklor Properties Llc
Purchase Details
Closed on
Nov 5, 2009
Sold by
Federal Home Loan Mortgage Corporation
Bought by
Tristate Holdings Inc
Purchase Details
Closed on
Oct 19, 2009
Sold by
Savage Patti J
Bought by
Federal Home Loan Mortgage Corporation
Purchase Details
Closed on
Sep 25, 2000
Sold by
Poniske Amy J
Bought by
Savage Patti J
Home Financials for this Owner
Home Financials are based on the most recent Mortgage that was taken out on this home.
Original Mortgage
$110,400
Interest Rate
7.98%
Mortgage Type
FHA
Create a Home Valuation Report for This Property
The Home Valuation Report is an in-depth analysis detailing your home's value as well as a comparison with similar homes in the area
Home Values in the Area
Average Home Value in this Area
Purchase History
| Date | Buyer | Sale Price | Title Company |
|---|---|---|---|
| Oli Delaware Llc | $39,000 | None Available | |
| Oli Joint Ventures Llc | $1,811,438 | None Available | |
| Penklor Properties Llc | $45,000 | Attorney | |
| Tristate Holdings Inc | $38,500 | Attorney | |
| Federal Home Loan Mortgage Corporation | $50,000 | None Available | |
| Savage Patti J | $111,000 | Performance Title Agency Inc |
Source: Public Records
Mortgage History
| Date | Status | Borrower | Loan Amount |
|---|---|---|---|
| Previous Owner | Oli Joint Ventures Llc | $3,000,000 | |
| Previous Owner | Savage Patti J | $110,400 |
Source: Public Records
Tax History
| Year | Tax Paid | Tax Assessment Tax Assessment Total Assessment is a certain percentage of the fair market value that is determined by local assessors to be the total taxable value of land and additions on the property. | Land | Improvement |
|---|---|---|---|---|
| 2025 | $2,568 | $39,393 | $6,759 | $32,634 |
| 2023 | $2,569 | $39,393 | $6,759 | $32,634 |
| 2022 | $2,266 | $31,123 | $6,647 | $24,476 |
| 2021 | $2,206 | $31,123 | $6,647 | $24,476 |
| 2020 | $2,212 | $31,123 | $6,647 | $24,476 |
| 2019 | $2,248 | $28,816 | $6,153 | $22,663 |
| 2018 | $2,404 | $28,816 | $6,153 | $22,663 |
| 2017 | $2,164 | $28,816 | $6,153 | $22,663 |
| 2016 | $1,174 | $14,966 | $6,153 | $8,813 |
| 2015 | $1,054 | $14,966 | $6,153 | $8,813 |
| 2014 | $1,059 | $14,966 | $6,153 | $8,813 |
| 2013 | $1,130 | $15,750 | $6,475 | $9,275 |
Source: Public Records
Map
Nearby Homes
- 8338 Anthony Wayne Ave
- 8421 Wiswell St
- 241 Oakmont St
- 42 Sheehan Ave
- 7871 Glenorchard Dr
- 529 Elliott Ave
- 29 Hartwell Ct
- 7831 Glen Orchard Dr
- 342 Durrell Ave
- 8318 Marley St
- 8081 Woodbine Ave
- 7829 Sunfield Dr
- 1808 Crest Hill Ave
- 25 Euclid Ave
- 177 Burns Ave
- 1501 Summit Rd
- 8415 Mayfair St
- 334 Williams St
- 415 Arlington Ave
- 20 Clark Rd
- 8310 Curzon Ave
- 272 Hartwell Ave
- 252 Hartwell Ave Unit 1
- 252 Hartwell Ave
- 8316 Curzon Ave
- 8309 Anthony Wayne Ave
- 8315 Curzon Ave
- 248 Hartwell Ave
- 8313 Anthony Wayne Ave
- 8319 Curzon Ave
- 244 Hartwell Ave
- 8317 Anthony Wayne Ave
- 241 Hunsford St
- 238 Hartwell Ave
- 8321-8333 Anthony Wayne Ave
- 8321 Anthony Wayne Ave
- 8279 Anthony Wayne Ave
- 237 Hunsford St
- 234 Hartwell Ave
- 8330 Curzon Ave
Your Personal Tour Guide
Ask me questions while you tour the home.