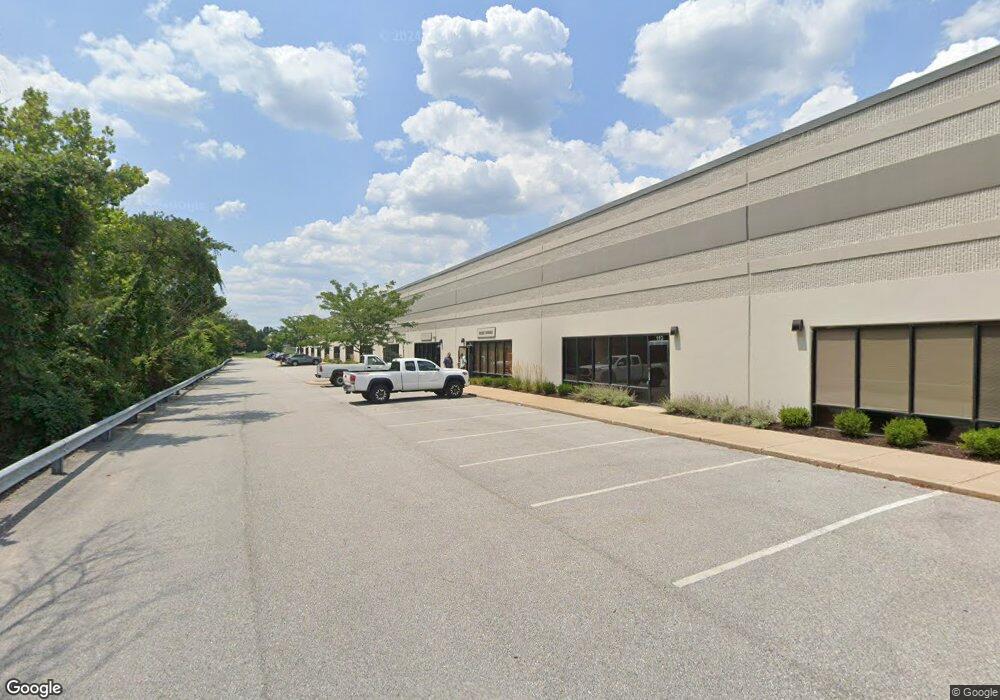
8306 Patuxent Range Rd Jessup, MD 20794
Estimated Value: $13,413,544
--
Bed
--
Bath
76,125
Sq Ft
$176/Sq Ft
Est. Value
About This Home
This home is located at 8306 Patuxent Range Rd, Jessup, MD 20794 and is currently estimated at $13,413,544, approximately $176 per square foot. 8306 Patuxent Range Rd is a home located in Howard County with nearby schools including Hanover Hills Elementary, Thomas Viaduct Middle School, and Bethel Christian Academy.
Ownership History
Date
Name
Owned For
Owner Type
Purchase Details
Closed on
Nov 30, 2018
Sold by
Icon Owner Pool 2 West Northeast Midwest
Bought by
Ta Mid Point Portfolio Llc
Current Estimated Value
Purchase Details
Closed on
Jul 27, 2018
Sold by
Icon Dp Md Owner Pool 2 West Northeast M
Bought by
Icon Owner Pool 2 West Northeast Midwest
Purchase Details
Closed on
Jun 21, 2012
Sold by
Rph Industrial Llc
Bought by
Bre Dp Md Llc
Home Financials for this Owner
Home Financials are based on the most recent Mortgage that was taken out on this home.
Original Mortgage
$0
Interest Rate
3.78%
Purchase Details
Closed on
Sep 17, 2003
Sold by
Cc & Fra Investment Properties
Bought by
Rph Industrial Llc
Purchase Details
Closed on
Aug 9, 1990
Sold by
Equitable Asslurance The
Bought by
Cc & Fra Investment Properties
Create a Home Valuation Report for This Property
The Home Valuation Report is an in-depth analysis detailing your home's value as well as a comparison with similar homes in the area
Home Values in the Area
Average Home Value in this Area
Purchase History
| Date | Buyer | Sale Price | Title Company |
|---|---|---|---|
| Ta Mid Point Portfolio Llc | $9,436,683 | First American Title In Co | |
| Icon Owner Pool 2 West Northeast Midwest | -- | First American Title Ins Co | |
| Bre Dp Md Llc | $10,300,000 | Chicago Title Insurance Co | |
| Rph Industrial Llc | -- | -- | |
| Cc & Fra Investment Properties | $6,050,000 | -- |
Source: Public Records
Mortgage History
| Date | Status | Borrower | Loan Amount |
|---|---|---|---|
| Previous Owner | Bre Dp Md Llc | $0 | |
| Closed | Bre Dp Md Llc | $0 |
Source: Public Records
Tax History Compared to Growth
Tax History
| Year | Tax Paid | Tax Assessment Tax Assessment Total Assessment is a certain percentage of the fair market value that is determined by local assessors to be the total taxable value of land and additions on the property. | Land | Improvement |
|---|---|---|---|---|
| 2025 | $94,663 | $6,321,900 | $1,194,400 | $5,127,500 |
| 2024 | $94,663 | $6,015,567 | $0 | $0 |
| 2023 | $86,154 | $5,709,233 | $0 | $0 |
| 2022 | $81,531 | $5,402,900 | $1,194,400 | $4,208,500 |
| 2021 | $71,928 | $4,985,267 | $0 | $0 |
| 2020 | $68,927 | $4,567,633 | $0 | $0 |
| 2019 | $59,843 | $4,150,000 | $1,194,400 | $2,955,600 |
| 2018 | $59,330 | $4,102,933 | $0 | $0 |
| 2017 | $54,626 | $4,740,500 | $0 | $0 |
| 2016 | -- | $3,660,000 | $0 | $0 |
| 2015 | -- | $3,198,267 | $0 | $0 |
| 2014 | -- | $3,122,067 | $0 | $0 |
Source: Public Records
Map
Nearby Homes
- 8304 Firewood Ct
- 8353 Ashwood Rd Unit 8353
- 8281 Washington Blvd
- 8252 Glen Ct
- 10075 Guilford Rd
- 8861 Mission Rd
- 8449 Oak Meade Way
- 8230 Wellington Place
- 7911 Burkard Ln
- 8790 Lincoln St
- 8911 Josephs Coat Ct
- 8314 Wades Way
- Lot 7 Cedar Ave
- Lot 6 Cedar Ave
- 2357 Terrapin Crossing
- 7370 Cedar Ave
- 7368 Cedar Ave
- 8334 Woodward St
- 8304 Granville Rd
- 2384 Terrapin Crossing
- 8332 Bristol Ct
- 8290 Patuxent Range Rd
- 8310 Sherwick Ct
- 8350 Bristol Ct
- 8301 Patuxent Range Rd
- 8331 Bristol Ct
- 8291 Patuxent Range Rd
- 8351 Bristol Ct
- 8301 Sherwick Ct
- 8106 NW Stayton Dr
- 8325 Patuxent Range Rd
- 8391 Washington Blvd
- 8107 Stayton Dr
- 8280 Patuxent Range Rd Unit SUITE E-2
- 8280 Patuxent Range Rd Unit C-2
- 8280 Patuxent Range Rd Unit C-1
- 8280 Patuxent Range Rd Unit D
- 8280 Patuxent Range Rd Unit C
- 8280 Patuxent Range Rd Unit B
- 8280 Patuxent Range Rd Unit SUITE A-2