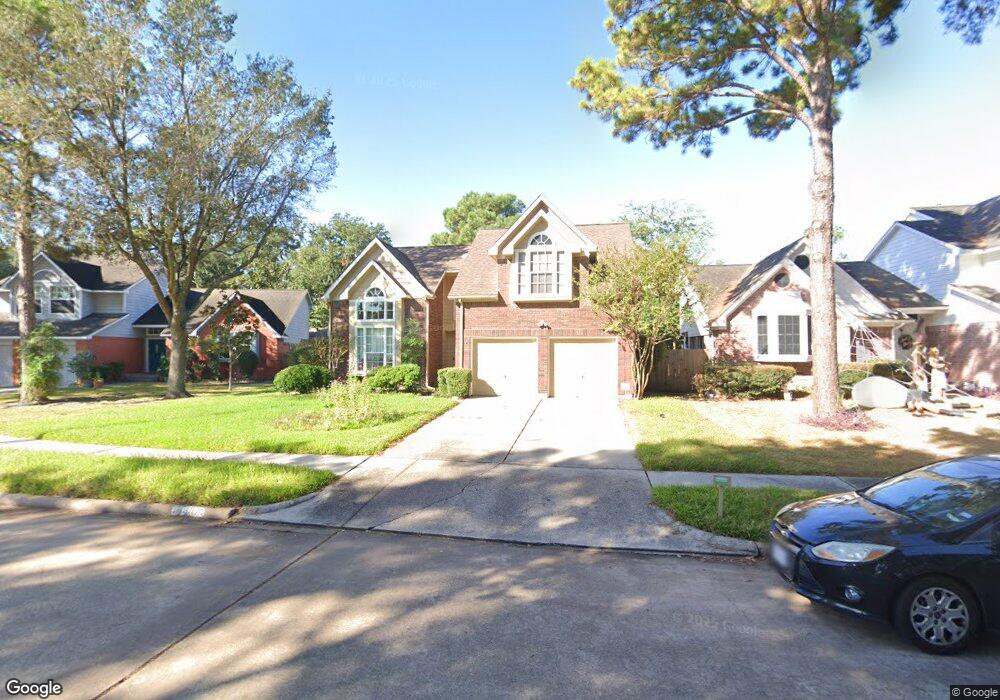
8307 Misty Trail Dr Houston, TX 77095
Copperfield NeighborhoodEstimated Value: $272,570 - $303,000
3
Beds
3
Baths
1,949
Sq Ft
$147/Sq Ft
Est. Value
About This Home
This home is located at 8307 Misty Trail Dr, Houston, TX 77095 and is currently estimated at $286,393, approximately $146 per square foot. 8307 Misty Trail Dr is a home located in Harris County with nearby schools including Fiest Elementary School, Labay Middle School, and Cypress Falls High School.
Ownership History
Date
Name
Owned For
Owner Type
Purchase Details
Closed on
Jul 22, 2005
Sold by
Rounds Kevin N
Bought by
Williams David B
Current Estimated Value
Home Financials for this Owner
Home Financials are based on the most recent Mortgage that was taken out on this home.
Original Mortgage
$101,500
Outstanding Balance
$52,813
Interest Rate
5.61%
Mortgage Type
FHA
Estimated Equity
$233,580
Purchase Details
Closed on
Jun 23, 2000
Sold by
Ramage Kenneth Ray and Ramage Caroline
Bought by
Rounds Kevin N
Home Financials for this Owner
Home Financials are based on the most recent Mortgage that was taken out on this home.
Original Mortgage
$93,500
Interest Rate
8.56%
Purchase Details
Closed on
Mar 25, 1994
Sold by
Gilbert Paul L and Gilbert Lisa D
Bought by
Ramage Kenneth Ray and Ramage Caroline
Home Financials for this Owner
Home Financials are based on the most recent Mortgage that was taken out on this home.
Original Mortgage
$94,900
Interest Rate
7.05%
Create a Home Valuation Report for This Property
The Home Valuation Report is an in-depth analysis detailing your home's value as well as a comparison with similar homes in the area
Home Values in the Area
Average Home Value in this Area
Purchase History
| Date | Buyer | Sale Price | Title Company |
|---|---|---|---|
| Williams David B | -- | Startex Title Company | |
| Rounds Kevin N | -- | -- | |
| Ramage Kenneth Ray | -- | Title Agency #40 |
Source: Public Records
Mortgage History
| Date | Status | Borrower | Loan Amount |
|---|---|---|---|
| Open | Williams David B | $101,500 | |
| Previous Owner | Rounds Kevin N | $93,500 | |
| Previous Owner | Ramage Kenneth Ray | $94,900 |
Source: Public Records
Tax History Compared to Growth
Tax History
| Year | Tax Paid | Tax Assessment Tax Assessment Total Assessment is a certain percentage of the fair market value that is determined by local assessors to be the total taxable value of land and additions on the property. | Land | Improvement |
|---|---|---|---|---|
| 2025 | $3,099 | $263,063 | $70,906 | $192,157 |
| 2024 | $3,099 | $260,000 | $63,370 | $196,630 |
| 2023 | $3,099 | $260,112 | $63,370 | $196,742 |
| 2022 | $4,515 | $237,331 | $48,641 | $188,690 |
| 2021 | $4,325 | $202,794 | $48,641 | $154,153 |
| 2020 | $4,039 | $169,345 | $40,420 | $128,925 |
| 2019 | $4,159 | $184,080 | $31,856 | $152,224 |
| 2018 | $1,405 | $153,200 | $31,856 | $121,344 |
| 2017 | $3,476 | $165,329 | $31,856 | $133,473 |
| 2016 | $3,160 | $165,329 | $31,856 | $133,473 |
| 2015 | $1,276 | $164,271 | $31,856 | $132,415 |
| 2014 | $1,276 | $140,655 | $26,718 | $113,937 |
Source: Public Records
Map
Nearby Homes
- 15918 Pinyon Creek Dr
- 8526 Hot Springs Dr
- 8426 Laurel Trails Dr
- 16026 Autumn Falls Ln
- 16215 Wemyss Bay Rd
- 8306 Lake Crystal Dr
- 16114 Kintyre Point Rd
- 16215 Cairngorm Ave
- 15954 Oak Mountain Dr
- 8550 Sparkling Springs Dr
- 8550 Waiting Spring Ln
- 16335 Drystone Ln
- 16315 Battlecreek Dr
- 16030 Royal Garden Dr
- 8203 Green Devon Dr
- 15854 Knolls Lodge Dr
- 16319 Chimneystone Dr
- 16510 Wellers Way
- 16403 Torry View Terrace
- 16426 Torry View Terrace
- 8311 Misty Trail Dr
- 8303 Misty Trail Dr
- 8310 Sparkling Springs Dr
- 8315 Misty Trail Dr
- 8314 Sparkling Springs Dr
- 0 West@eldridge Unit 28875740
- 16035 Elmbank Dr
- 8306 Sparkling Springs Dr
- 8330 E Cassy Creek Ct Unit 8330
- 11522 Harvard Oaks
- 11610 Harvard Oaks Dr
- 8418 Cape Royal Dr
- 8403 Sublime Point
- 16030 Elmbank Dr
- 8318 Sparkling Springs Dr
- 16054 Pinyon Creek Dr
- 8319 Misty Trail Dr
- 16031 Elmbank Dr
- 8314 Misty Trail Dr
- 8322 Sparkling Springs Dr