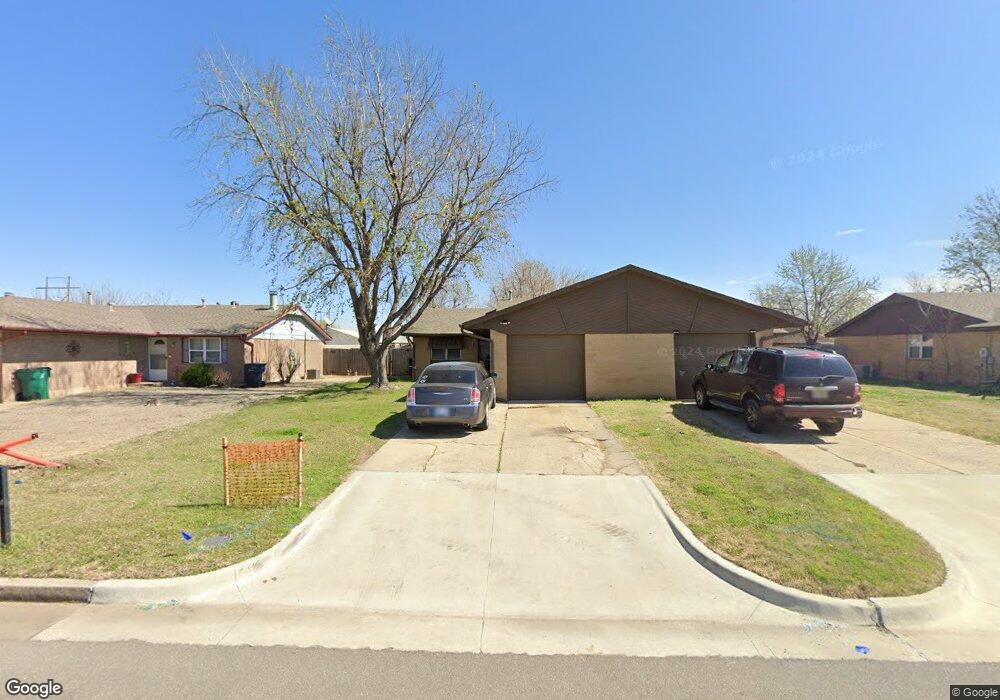
8308 S Brookline Ave Oklahoma City, OK 73159
Wingspread NeighborhoodEstimated Value: $101,000 - $129,000
2
Beds
1
Bath
934
Sq Ft
$127/Sq Ft
Est. Value
About This Home
This home is located at 8308 S Brookline Ave, Oklahoma City, OK 73159 and is currently estimated at $118,333, approximately $126 per square foot. 8308 S Brookline Ave is a home located in Oklahoma County with nearby schools including Fairview Elementary School, West Junior High School, and Westmoore High School.
Ownership History
Date
Name
Owned For
Owner Type
Purchase Details
Closed on
Feb 29, 2008
Sold by
Omni Investment Properties Llc
Bought by
Robinson Investments Inc
Current Estimated Value
Home Financials for this Owner
Home Financials are based on the most recent Mortgage that was taken out on this home.
Original Mortgage
$484,350
Outstanding Balance
$297,345
Interest Rate
5.47%
Mortgage Type
Purchase Money Mortgage
Estimated Equity
-$179,012
Purchase Details
Closed on
Jun 13, 2007
Sold by
Omni Property Investments Llc
Bought by
Omni Investment Properties Llc
Purchase Details
Closed on
Jun 20, 2006
Sold by
Roberts D Paul and Roberts Nancy J
Bought by
Omni Property Investments Llc
Purchase Details
Closed on
May 22, 1998
Sold by
Hines Sylvia Ann and Hines Jerry D
Bought by
Roberts D Paul and Roberts Nancy J
Create a Home Valuation Report for This Property
The Home Valuation Report is an in-depth analysis detailing your home's value as well as a comparison with similar homes in the area
Home Values in the Area
Average Home Value in this Area
Purchase History
| Date | Buyer | Sale Price | Title Company |
|---|---|---|---|
| Robinson Investments Inc | $645,000 | American Guaranty Title Co | |
| Omni Investment Properties Llc | -- | None Available | |
| Omni Property Investments Llc | -- | None Available | |
| Roberts D Paul | $33,500 | First Amer Title & Trust Co |
Source: Public Records
Mortgage History
| Date | Status | Borrower | Loan Amount |
|---|---|---|---|
| Open | Robinson Investments Inc | $484,350 |
Source: Public Records
Tax History Compared to Growth
Tax History
| Year | Tax Paid | Tax Assessment Tax Assessment Total Assessment is a certain percentage of the fair market value that is determined by local assessors to be the total taxable value of land and additions on the property. | Land | Improvement |
|---|---|---|---|---|
| 2024 | $879 | $7,754 | $930 | $6,824 |
| 2023 | $879 | $7,384 | $1,030 | $6,354 |
| 2022 | $855 | $7,033 | $1,064 | $5,969 |
| 2021 | $809 | $6,699 | $883 | $5,816 |
| 2020 | $776 | $6,380 | $1,029 | $5,351 |
| 2019 | $788 | $6,410 | $983 | $5,427 |
| 2018 | $760 | $6,105 | $0 | $0 |
| 2017 | $750 | $6,049 | $1,008 | $5,041 |
| 2016 | $754 | $5,994 | $1,008 | $4,986 |
| 2015 | $699 | $5,850 | $1,008 | $4,842 |
| 2014 | $706 | $5,818 | $1,008 | $4,810 |
Source: Public Records
Map
Nearby Homes
- 2848 SW 82nd St
- 2821 SW 86th St
- 3205 SW 86th St
- 8409 S Independence Ave
- 2832 SW 77th St
- 2721 SW 87th St
- 7017 S Miller Ave
- 7917 S Linn Ave
- 2500 SW 84th St
- 7909 S Villa Ave
- 7501 S Sherwood Ave Unit 16
- 8309 S Hillcrest Dr
- 8620 S Hillcrest Dr
- 2424 SW 86th St
- 3101 SW 71st St
- 2432 SW 80th St
- 2605 SW 92nd St
- 2443 SW 90th Place
- 2612 SW 71st St
- 3044 S Madole Blvd
- 8306 S Brookline Ave
- 8310 S Brookline Ave
- 8304 S Brookline Ave
- 8314 S Brookline Ave
- 8302 S Brookline Ave
- 8307 S Brookline Place
- 8303 S Brookline Place
- 8301 S Brookline Place
- 8309 S Brookline Place
- 8400 S Brookline Ave
- 2927 SW 82nd St
- 8311 S Brookline Place
- 8303 S Brookline Ave
- 8300 S Brookline Ave
- 8309 S Brookline Ave
- 8301 S Brookline Ave
- 8401 S Brookline Place
- 8402 S Brookline Ave
- 2925 SW 82nd St
- 8403 S Brookline Place