Estimated Value: $477,000 - $854,000
4
Beds
3
Baths
3,032
Sq Ft
$207/Sq Ft
Est. Value
About This Home
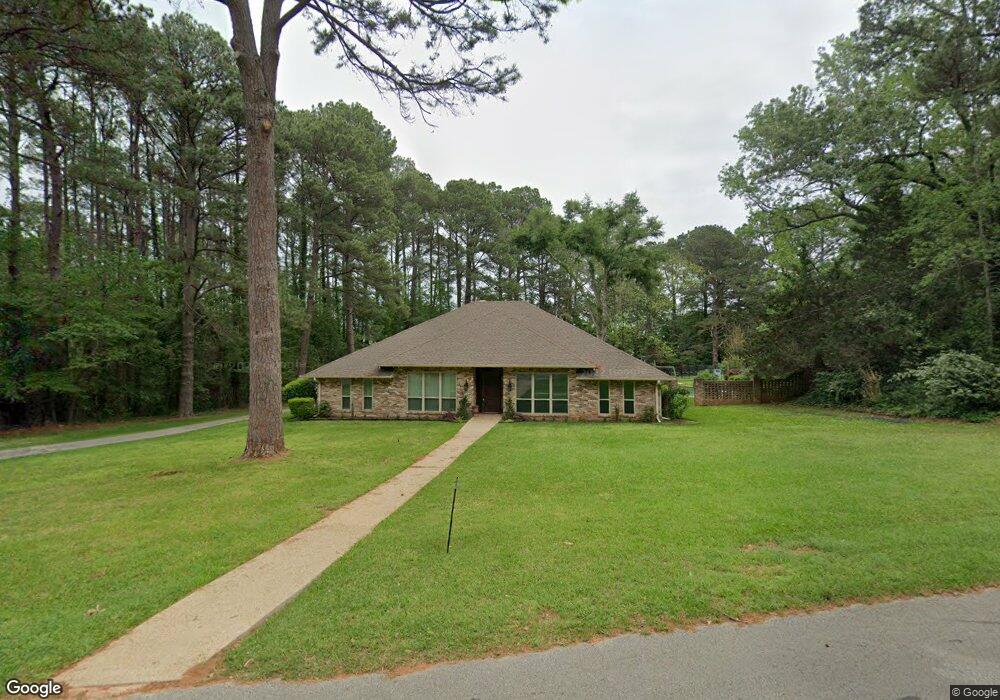
This home is located at 8308 Southland Dr, Tyler, TX 75703 and is currently estimated at $626,211, approximately $206 per square foot. 8308 Southland Dr is a home located in Smith County with nearby schools including Rice Elementary School, Hubbard Middle School, and Tyler Legacy High School.
Ownership History
Date
Name
Owned For
Owner Type
Purchase Details
Closed on
Apr 25, 2022
Sold by
Dison and Taylor
Bought by
Addison Kasi and Addison Austin
Current Estimated Value
Home Financials for this Owner
Home Financials are based on the most recent Mortgage that was taken out on this home.
Original Mortgage
$591,600
Outstanding Balance
$554,037
Interest Rate
4.13%
Mortgage Type
New Conventional
Estimated Equity
$72,174
Purchase Details
Closed on
Jul 30, 2021
Sold by
Hanson James
Bought by
Jtd Ventures Llc
Home Financials for this Owner
Home Financials are based on the most recent Mortgage that was taken out on this home.
Original Mortgage
$407,200
Interest Rate
3%
Mortgage Type
Commercial
Purchase Details
Closed on
Jan 6, 2016
Sold by
Colwell Teresa Estella
Bought by
Dison Jack and Dison Taylor
Home Financials for this Owner
Home Financials are based on the most recent Mortgage that was taken out on this home.
Original Mortgage
$265,109
Interest Rate
3.62%
Mortgage Type
FHA
Create a Home Valuation Report for This Property
The Home Valuation Report is an in-depth analysis detailing your home's value as well as a comparison with similar homes in the area
Home Values in the Area
Average Home Value in this Area
Purchase History
| Date | Buyer | Sale Price | Title Company |
|---|---|---|---|
| Addison Kasi | -- | None Listed On Document | |
| Jtd Ventures Llc | -- | None Available | |
| Dison Jack | -- | None Available |
Source: Public Records
Mortgage History
| Date | Status | Borrower | Loan Amount |
|---|---|---|---|
| Open | Addison Kasi | $591,600 | |
| Previous Owner | Jtd Ventures Llc | $407,200 | |
| Previous Owner | Dison Jack | $265,109 |
Source: Public Records
Tax History Compared to Growth
Tax History
| Year | Tax Paid | Tax Assessment Tax Assessment Total Assessment is a certain percentage of the fair market value that is determined by local assessors to be the total taxable value of land and additions on the property. | Land | Improvement |
|---|---|---|---|---|
| 2025 | $8,382 | $566,679 | $173,280 | $393,399 |
| 2024 | $8,382 | $492,708 | $88,000 | $404,708 |
| 2023 | $9,148 | $524,767 | $88,000 | $436,767 |
| 2022 | $5,947 | $303,544 | $44,000 | $259,544 |
| 2021 | $5,940 | $283,126 | $44,000 | $239,126 |
| 2020 | $6,058 | $283,126 | $44,000 | $239,126 |
| 2019 | $6,042 | $276,288 | $44,000 | $232,288 |
| 2018 | $5,843 | $268,668 | $44,000 | $224,668 |
| 2017 | $5,740 | $268,841 | $44,000 | $224,841 |
| 2016 | $5,744 | $269,044 | $44,000 | $225,044 |
| 2015 | $4,255 | $261,899 | $44,250 | $217,649 |
| 2014 | $4,255 | $255,328 | $44,250 | $211,078 |
Source: Public Records
Map
Nearby Homes
- 308 Canterbury Ct
- 8310 Columbia Dr
- 419 Wilder Way
- 628 Wilder Way
- 8312 Oxford Dr
- 7889 Greenhill Dr
- 7415 Hollyoak Dr
- 411 W Heritage Dr
- 7614 Abbeywood Ct
- 8412 Crooked Trail
- 700 Oxford Dr
- 8416 Crooked Trail
- 708 Oxford Cir
- 719 Cambridge Bend Cir
- The Beckham Plan at Cumberland Place West
- The Tanglewood Plan at Cumberland Place West
- The Augusta Plan at Cumberland Place West
- The Donnybrook Plan at Cumberland Place West
- The Charnwood Plan at Cumberland Place West
- The Belmont Plan at Cumberland Place West
- 8308 8308 Southland Dr
- 301 Cambridge Rd
- 8307 Southland Dr
- 8413 Southland Dr
- 8455 Southland Dr
- 217 Cambridge Rd
- 8485 Southland Dr
- 8425 Southland Dr
- 8449 8449 Southland
- 8449 Southland Dr
- 7800 Chancery Ln
- 7804 Chancery Ln
- 7806 Chancery Ln
- 8421 8421 Southland Dr
- 7900 Chancery Ln
- 7900 7900 Chancery
- 8321 Columbia Dr
- 8320 Yale Dr
- 8421 Southland Dr
- 8443 Southland Dr