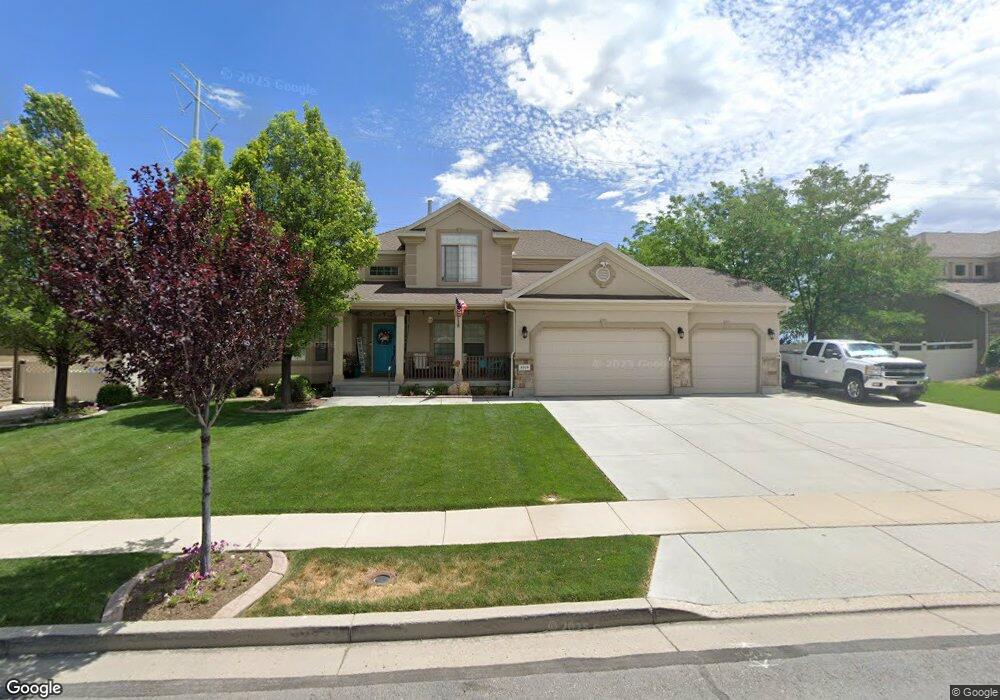
8309 Maple Water Dr West Jordan, UT 84081
Jordan Hills NeighborhoodEstimated Value: $680,000 - $734,000
4
Beds
3
Baths
2,333
Sq Ft
$307/Sq Ft
Est. Value
About This Home
This home is located at 8309 Maple Water Dr, West Jordan, UT 84081 and is currently estimated at $715,775, approximately $306 per square foot. 8309 Maple Water Dr is a home located in Salt Lake County with nearby schools including Fox Hollow School, Sunset Ridge Middle School, and Copper Hills High School.
Ownership History
Date
Name
Owned For
Owner Type
Purchase Details
Closed on
Aug 6, 2010
Sold by
Jones Dameon and Jones Laurel
Bought by
Jones Dameon R and Jones Laurel D
Current Estimated Value
Home Financials for this Owner
Home Financials are based on the most recent Mortgage that was taken out on this home.
Original Mortgage
$252,000
Outstanding Balance
$166,427
Interest Rate
4.52%
Mortgage Type
New Conventional
Estimated Equity
$549,348
Purchase Details
Closed on
Mar 25, 2010
Sold by
Federal Home Loan Mortgage Corporation
Bought by
Jones Dameon and Jones Laurel
Purchase Details
Closed on
Feb 3, 2010
Sold by
Bac Home Loans Servicing Lp
Bought by
Federal Home Loan Mortgage Corp
Purchase Details
Closed on
Apr 24, 2007
Sold by
Ivory Homes Ltd
Bought by
Andrade Joe and Villa Yanet
Home Financials for this Owner
Home Financials are based on the most recent Mortgage that was taken out on this home.
Original Mortgage
$41,800
Interest Rate
5.84%
Mortgage Type
Stand Alone Second
Create a Home Valuation Report for This Property
The Home Valuation Report is an in-depth analysis detailing your home's value as well as a comparison with similar homes in the area
Home Values in the Area
Average Home Value in this Area
Purchase History
| Date | Buyer | Sale Price | Title Company |
|---|---|---|---|
| Jones Dameon R | -- | Title One | |
| Jones Dameon | -- | Bonneville Superior Title | |
| Federal Home Loan Mortgage Corp | -- | Backman Title Services | |
| Bac Home Loans Servicing Lp | $286,000 | Backman Title Services | |
| Andrade Joe | -- | Cottonwood Title Ins Agency |
Source: Public Records
Mortgage History
| Date | Status | Borrower | Loan Amount |
|---|---|---|---|
| Open | Jones Dameon R | $252,000 | |
| Previous Owner | Andrade Joe | $41,800 | |
| Previous Owner | Andrade Joe | $334,400 |
Source: Public Records
Tax History Compared to Growth
Tax History
| Year | Tax Paid | Tax Assessment Tax Assessment Total Assessment is a certain percentage of the fair market value that is determined by local assessors to be the total taxable value of land and additions on the property. | Land | Improvement |
|---|---|---|---|---|
| 2025 | $3,415 | $677,100 | $166,100 | $511,000 |
| 2024 | $3,415 | $657,000 | $161,200 | $495,800 |
| 2023 | $3,461 | $627,600 | $155,000 | $472,600 |
| 2022 | $3,606 | $643,300 | $152,000 | $491,300 |
| 2021 | $3,034 | $492,700 | $119,700 | $373,000 |
| 2020 | $2,963 | $451,600 | $119,700 | $331,900 |
| 2019 | $2,989 | $446,700 | $119,700 | $327,000 |
| 2018 | $2,837 | $420,500 | $117,800 | $302,700 |
| 2017 | $2,678 | $395,200 | $117,800 | $277,400 |
| 2016 | $2,718 | $376,800 | $115,000 | $261,800 |
| 2015 | $2,702 | $365,300 | $117,100 | $248,200 |
| 2014 | $2,461 | $327,500 | $106,200 | $221,300 |
Source: Public Records
Map
Nearby Homes
- 5746 W Swift Creek Rd
- 5946 W Eric Mountain Ln
- 5958 W Eric Mountain Ln
- 5958 W Eric Mountain Ln Unit 104
- 5933 W Eric Mountain Ln Unit 119
- 8524 S Michele River Ave
- 5923 W 8170 S Unit U102
- 8501 S Michele River Ave
- 8501 S Michele River Ave Unit 116
- 5719 W Boulder Creek Rd
- Tuscarora Plan at Copperhaven by Toll Brothers
- Larsen Plan at Copperhaven by Toll Brothers
- Brooke Plan at Copperhaven by Toll Brothers
- Millcreek Plan at Copperhaven by Toll Brothers
- 5958 W 8100 S
- 5702 W Sophia Brook Ln
- 6031 W Highlandbrook Dr
- Clarke 2 Plan at Addenbrook Townhomes
- 8368 S Oak Gate Dr
- 8356 S Four Elm Cir Unit 1
- 8309 S Maple Water Dr
- 8293 Maple Water Dr
- 8327 Maple Water Dr
- 8327 S Maple Water Dr
- 5912 W Maple Canyon Rd
- 8279 Maple Water Dr
- 8279 S Maple Water Dr
- 5913 W Cliff Rose Ct
- 5912 Maple Canyon Rd
- 5911 W Maple Canyon Rd
- 5911 Maple Canyon Rd
- 5932 Maple Canyon Rd
- 5932 W Maple Canyon Rd
- 5929 Cliff Rose Ct
- 5929 W Cliff Rose Ct
- 8263 Maple Water Dr
- 8263 S Maple Water Dr
- 5914 W Cliff Rose Ct
- 5931 W Maple Canyon Rd
- 8367 S Maple Water Dr