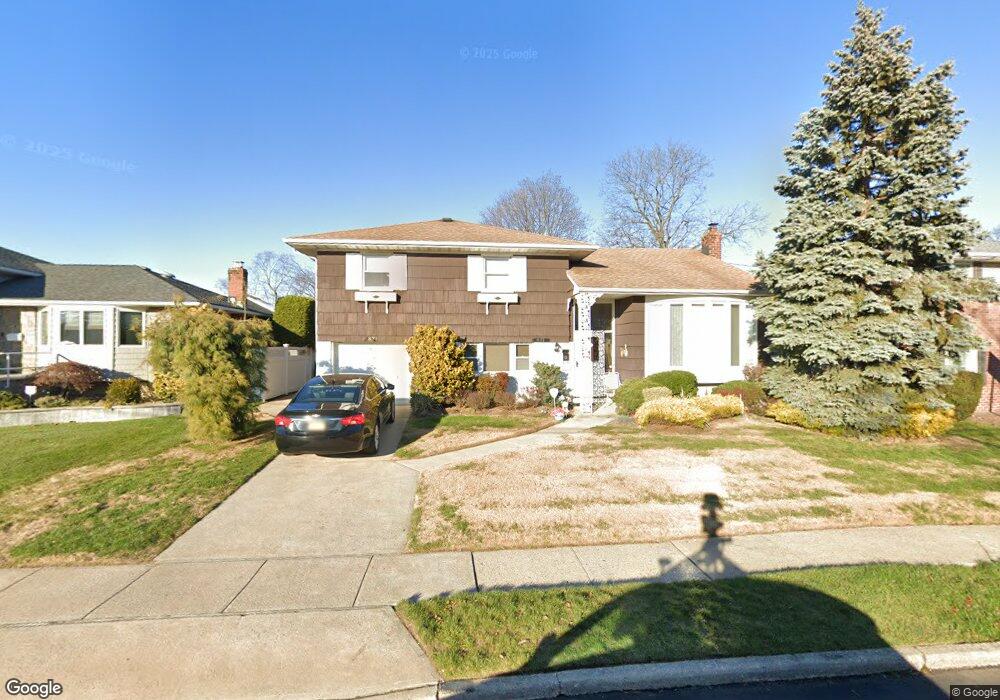
831 Beckman Dr North Bellmore, NY 11710
Estimated Value: $679,000 - $733,975
--
Bed
3
Baths
1,372
Sq Ft
$515/Sq Ft
Est. Value
About This Home
This home is located at 831 Beckman Dr, North Bellmore, NY 11710 and is currently estimated at $706,488, approximately $514 per square foot. 831 Beckman Dr is a home located in Nassau County with nearby schools including Weatherford West Elementary School, Lt. General Thomas P. Stafford Elementary School, and Grand Avenue Middle School.
Ownership History
Date
Name
Owned For
Owner Type
Purchase Details
Closed on
Mar 28, 2024
Sold by
Bogatz William R and Klein Debra J
Bought by
Subrati Nicole and Ramkumar Ajay B
Current Estimated Value
Home Financials for this Owner
Home Financials are based on the most recent Mortgage that was taken out on this home.
Original Mortgage
$585,000
Outstanding Balance
$574,911
Interest Rate
6.74%
Mortgage Type
New Conventional
Estimated Equity
$131,577
Purchase Details
Closed on
Feb 25, 2009
Sold by
Bogatz Gerald and Bogatz Sandra
Bought by
Bogatz William R and Klein Debra J
Purchase Details
Closed on
May 26, 2006
Sold by
Bogatz Sandra
Create a Home Valuation Report for This Property
The Home Valuation Report is an in-depth analysis detailing your home's value as well as a comparison with similar homes in the area
Home Values in the Area
Average Home Value in this Area
Purchase History
| Date | Buyer | Sale Price | Title Company |
|---|---|---|---|
| Subrati Nicole | $650,000 | Pro National Title Agency | |
| Subrati Nicole | $650,000 | Pro National Title Agency | |
| Bogatz William R | -- | Attorney | |
| Bogatz William R | -- | Attorney | |
| Bogatz William R | -- | Attorney | |
| -- | -- | -- | |
| -- | -- | -- |
Source: Public Records
Mortgage History
| Date | Status | Borrower | Loan Amount |
|---|---|---|---|
| Open | Subrati Nicole | $585,000 | |
| Closed | Subrati Nicole | $585,000 |
Source: Public Records
Tax History Compared to Growth
Tax History
| Year | Tax Paid | Tax Assessment Tax Assessment Total Assessment is a certain percentage of the fair market value that is determined by local assessors to be the total taxable value of land and additions on the property. | Land | Improvement |
|---|---|---|---|---|
| 2025 | $13,460 | $508 | $182 | $326 |
| 2024 | $3,587 | $512 | $183 | $329 |
| 2023 | $11,740 | $535 | $192 | $343 |
| 2022 | $11,740 | $528 | $189 | $339 |
| 2021 | $14,466 | $522 | $187 | $335 |
| 2020 | $10,165 | $553 | $470 | $83 |
| 2019 | $8,693 | $593 | $473 | $120 |
| 2018 | $8,789 | $632 | $0 | $0 |
| 2017 | $5,943 | $672 | $476 | $196 |
| 2016 | $8,940 | $711 | $453 | $258 |
| 2015 | $3,105 | $751 | $479 | $272 |
| 2014 | $3,105 | $751 | $479 | $272 |
| 2013 | $3,068 | $791 | $504 | $287 |
Source: Public Records
Map
Nearby Homes
- 886 Bellmore Ave
- 2758 Mayfield Place
- 736 Bellmore Rd
- 2548 Columbus Ave
- 930 W Shelley Rd
- 899 Brent Dr
- 980 Siems Ct
- 2846 Walter Rd
- 646 Evelyn Ave
- 2477 Columbus Ave
- 2906 Lawrence Dr
- 975 Little Neck Ave
- 985 Douglas Ave
- 1010 Brent Dr
- 2393 Elk Ct
- 2197 Jeffrey Dr
- 2497 Tonquin St
- 2479 Tonquin St
- 650 Newbridge Rd Unit 33
- 650 Newbridge Rd Unit 9