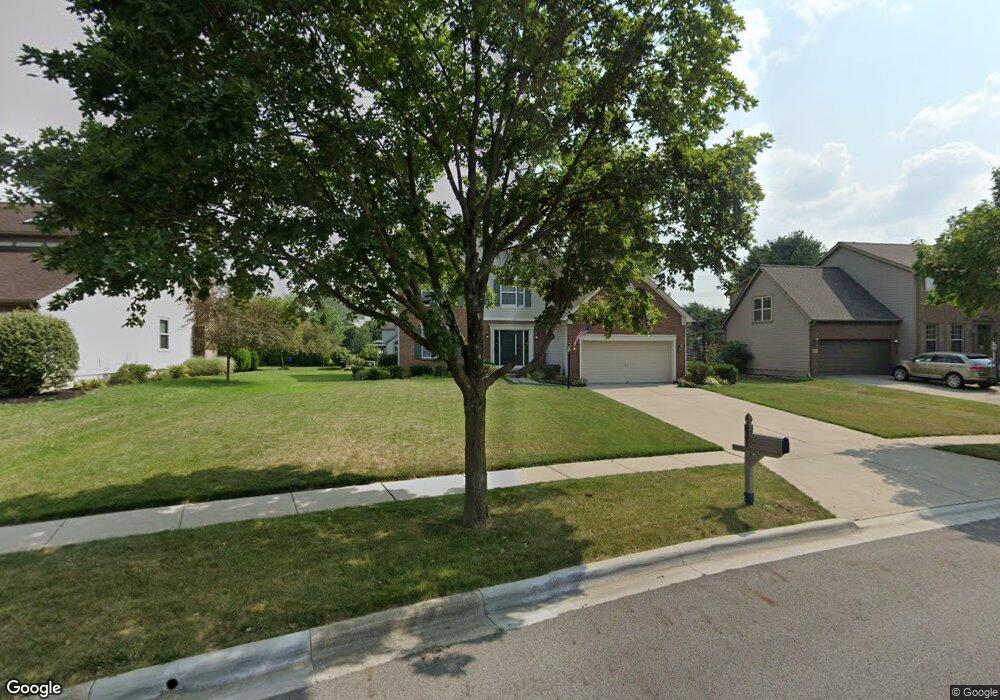
831 Brookside Dr Pickerington, OH 43147
Estimated Value: $399,000 - $431,000
4
Beds
3
Baths
2,564
Sq Ft
$163/Sq Ft
Est. Value
About This Home
This home is located at 831 Brookside Dr, Pickerington, OH 43147 and is currently estimated at $418,252, approximately $163 per square foot. 831 Brookside Dr is a home located in Fairfield County with nearby schools including Violet Elementary School, Pickerington Lakeview Junior High School, and Toll Gate Middle School.
Ownership History
Date
Name
Owned For
Owner Type
Purchase Details
Closed on
Jul 1, 1998
Sold by
Humphrey William R
Bought by
Hartless Marsena T
Current Estimated Value
Home Financials for this Owner
Home Financials are based on the most recent Mortgage that was taken out on this home.
Original Mortgage
$146,150
Outstanding Balance
$26,287
Interest Rate
7.18%
Mortgage Type
New Conventional
Estimated Equity
$391,965
Purchase Details
Closed on
Jun 2, 1995
Sold by
Ryland Group
Bought by
Humphrey William R and Humphrey Sue A
Home Financials for this Owner
Home Financials are based on the most recent Mortgage that was taken out on this home.
Original Mortgage
$160,200
Interest Rate
6.5%
Mortgage Type
New Conventional
Purchase Details
Closed on
May 18, 1994
Bought by
Ryland Group Inc The
Create a Home Valuation Report for This Property
The Home Valuation Report is an in-depth analysis detailing your home's value as well as a comparison with similar homes in the area
Home Values in the Area
Average Home Value in this Area
Purchase History
| Date | Buyer | Sale Price | Title Company |
|---|---|---|---|
| Hartless Marsena T | $194,900 | -- | |
| Humphrey William R | $178,000 | -- | |
| Ryland Group Inc The | $24,300 | -- |
Source: Public Records
Mortgage History
| Date | Status | Borrower | Loan Amount |
|---|---|---|---|
| Open | Hartless Marsena T | $146,150 | |
| Previous Owner | Humphrey William R | $160,200 |
Source: Public Records
Tax History
| Year | Tax Paid | Tax Assessment Tax Assessment Total Assessment is a certain percentage of the fair market value that is determined by local assessors to be the total taxable value of land and additions on the property. | Land | Improvement |
|---|---|---|---|---|
| 2025 | $12,796 | $130,740 | $29,530 | $101,210 |
| 2024 | $12,796 | $103,950 | $17,090 | $86,860 |
| 2023 | $4,469 | $103,950 | $17,090 | $86,860 |
| 2022 | $4,503 | $103,950 | $17,090 | $86,860 |
| 2021 | $4,021 | $81,150 | $15,540 | $65,610 |
| 2020 | $4,065 | $81,150 | $15,540 | $65,610 |
| 2019 | $4,091 | $81,150 | $15,540 | $65,610 |
| 2018 | $4,021 | $70,440 | $15,540 | $54,900 |
| 2017 | $4,026 | $70,780 | $15,670 | $55,110 |
| 2016 | $4,006 | $70,780 | $15,670 | $55,110 |
| 2015 | $3,746 | $63,600 | $13,060 | $50,540 |
| 2014 | $3,701 | $63,600 | $13,060 | $50,540 |
| 2013 | $3,701 | $63,600 | $13,060 | $50,540 |
Source: Public Records
Map
Nearby Homes
- 692 Hill Rd N
- 6448 Bemington Trai
- 559 Cherry Hill Dr
- 780 Diley Rd
- 495 Courtland Ln
- 477 Courtland Ln
- 807 Littleton Dr
- 760 N Starr Dr
- 12316 Thoroughbred Dr
- 128 Jamie Lynn Cir Unit 128
- 368 Colony Park Dr
- 9841 Woodsfield Cir S
- 748 Wharncliff Loop
- 11681 Village Way Dr
- 292 Maple Place
- 9656 Meadow Wood Dr
- 12478 Thoroughbred Dr
- 8715 Ravine Ave
- 353 Florence Dr
- 0 Windmiller Dr
- 837 Brookside Dr
- 745 McLeod Parc
- 841 Umbleby Place
- 739 McLeod Parc
- 9509 Brookside Dr
- 828 Brookside Dr
- 836 Brookside Dr
- 751 McLeod Parc
- 843 Umbleby Place
- 733 McLeod Parc
- 9527 Brookside Dr
- 9514 Brookside Dr
- 858 Umbleby Place
- 839 Mcleod
- 760 Mcleod
- 781 Saint Andrews Ct
- 845 Umbleby Place
- 757 McLeod Parc
- 775 Saint Andrews Ct
- 842 Brookside Dr
Your Personal Tour Guide
Ask me questions while you tour the home.