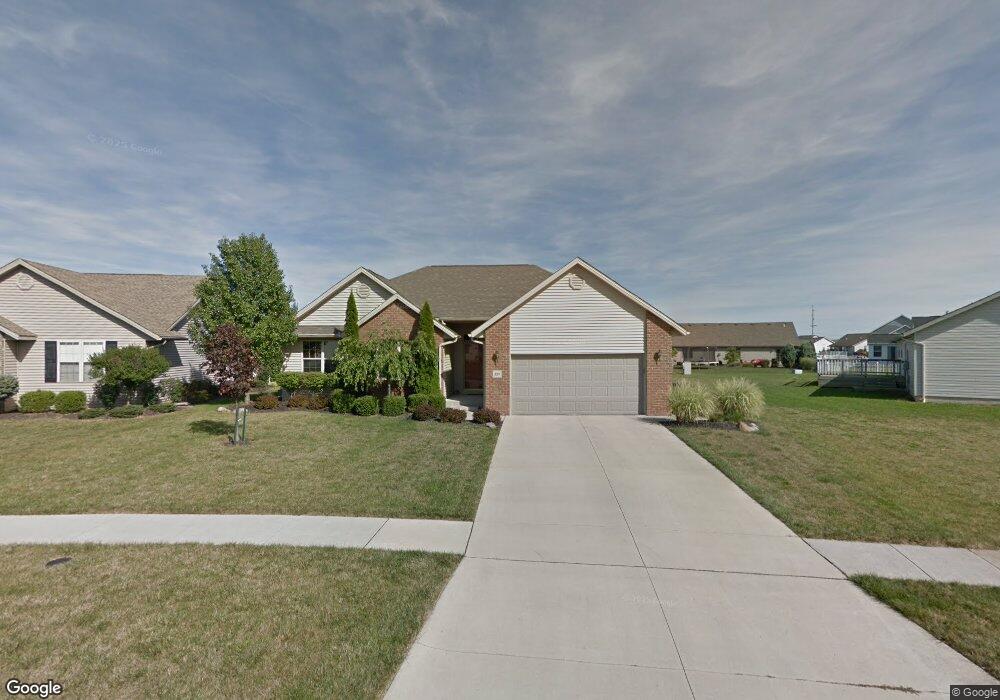
831 Colt Dr Findlay, OH 45840
Estimated Value: $314,000 - $330,000
3
Beds
2
Baths
1,676
Sq Ft
$192/Sq Ft
Est. Value
About This Home
This home is located at 831 Colt Dr, Findlay, OH 45840 and is currently estimated at $322,030, approximately $192 per square foot. 831 Colt Dr is a home located in Hancock County with nearby schools including Wilson Vance Elementary School, Whittier Elementary School, and Donnell Middle School.
Ownership History
Date
Name
Owned For
Owner Type
Purchase Details
Closed on
Dec 31, 2014
Sold by
Poling Scott M and Poling Erin E
Bought by
Riley Tyler W
Current Estimated Value
Home Financials for this Owner
Home Financials are based on the most recent Mortgage that was taken out on this home.
Original Mortgage
$172,900
Outstanding Balance
$132,969
Interest Rate
3.95%
Mortgage Type
New Conventional
Estimated Equity
$189,061
Purchase Details
Closed on
Mar 26, 2009
Sold by
Poling Scott M
Bought by
Poling Scott M and Poling Erin E
Home Financials for this Owner
Home Financials are based on the most recent Mortgage that was taken out on this home.
Original Mortgage
$128,920
Interest Rate
5.11%
Mortgage Type
New Conventional
Purchase Details
Closed on
Oct 30, 2003
Sold by
Best Roger
Bought by
Poling Scott M
Home Financials for this Owner
Home Financials are based on the most recent Mortgage that was taken out on this home.
Original Mortgage
$164,730
Interest Rate
6.01%
Mortgage Type
Purchase Money Mortgage
Create a Home Valuation Report for This Property
The Home Valuation Report is an in-depth analysis detailing your home's value as well as a comparison with similar homes in the area
Home Values in the Area
Average Home Value in this Area
Purchase History
| Date | Buyer | Sale Price | Title Company |
|---|---|---|---|
| Riley Tyler W | $182,000 | Mid Am Title | |
| Poling Scott M | -- | Mid Am Title | |
| Poling Scott M | $173,666 | -- |
Source: Public Records
Mortgage History
| Date | Status | Borrower | Loan Amount |
|---|---|---|---|
| Open | Riley Tyler W | $172,900 | |
| Previous Owner | Poling Scott M | $128,920 | |
| Previous Owner | Poling Scott M | $164,730 |
Source: Public Records
Tax History
| Year | Tax Paid | Tax Assessment Tax Assessment Total Assessment is a certain percentage of the fair market value that is determined by local assessors to be the total taxable value of land and additions on the property. | Land | Improvement |
|---|---|---|---|---|
| 2024 | $2,950 | $83,050 | $12,750 | $70,300 |
| 2023 | $2,955 | $83,050 | $12,750 | $70,300 |
| 2022 | $2,944 | $83,050 | $12,750 | $70,300 |
| 2021 | $2,792 | $66,030 | $11,880 | $54,150 |
| 2020 | $2,687 | $66,030 | $11,880 | $54,150 |
| 2019 | $2,741 | $66,030 | $11,880 | $54,150 |
| 2018 | $2,610 | $57,600 | $7,920 | $49,680 |
| 2017 | $1,307 | $57,600 | $7,920 | $49,680 |
| 2016 | $2,575 | $57,600 | $7,920 | $49,680 |
| 2015 | $2,497 | $54,710 | $8,430 | $46,280 |
| 2014 | $2,499 | $54,710 | $8,430 | $46,280 |
| 2012 | $2,777 | $60,490 | $8,430 | $52,060 |
Source: Public Records
Map
Nearby Homes
- 1480 Timberwood Dr
- 1421 Autumn Dr
- 1200 1st St
- 1037 Fishlock Ave
- 1421 E Sandusky St
- 15591 Canadian Way
- 15586 Canadian Way
- 15615 Canadian Way
- 0 Blanchard Ave
- 1001 Decker Ave
- 309 Huron Rd
- 1100 Stall Dr
- 1515 Burson Dr
- 1709 Eastview Dr
- 731 5th St
- 1726 Eastview Dr
- 1020 Country Club Dr
- 401 Westchester Dr
- 640 Center St
- 2047 Imperial Ln
- 821 Colt Dr
- 1400 Timberwood Dr
- 850 Tarra Oaks Dr
- 811 Colt Dr
- 840 Tarra Oaks Dr
- 900 Tarra Oaks Dr
- 908 Tarra Oaks Dr
- 830 Tarra Oaks Dr
- 1400 Kennsington Dr
- 820 Colt Dr
- 801 Colt Dr
- 1405 Timberwood Dr
- 820 Tarra Oaks Dr
- 810 Colt Dr
- 353 Tara Oaks Dr
- 354 Tara Oaks Dr
- 355 Tara Oaks Dr
- 357 Tara Oaks Dr
- 358 Tara Oaks Dr
Your Personal Tour Guide
Ask me questions while you tour the home.