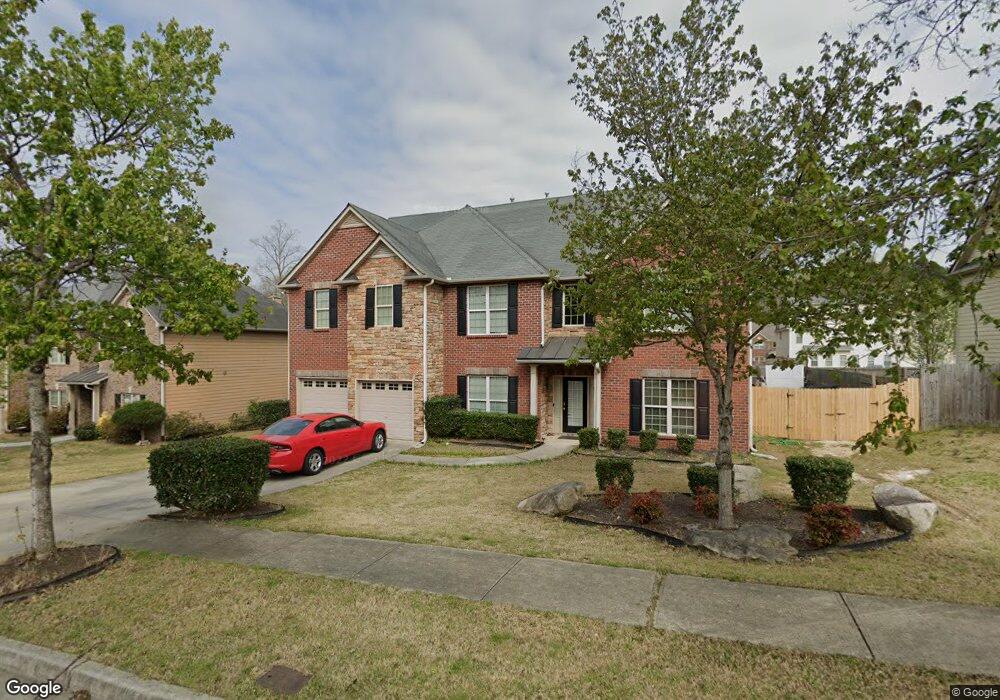
831 Langley Farms Dr SW Loganville, GA 30052
Estimated Value: $565,289 - $637,000
7
Beds
5
Baths
4,667
Sq Ft
$128/Sq Ft
Est. Value
About This Home
This home is located at 831 Langley Farms Dr SW, Loganville, GA 30052 and is currently estimated at $596,072, approximately $127 per square foot. 831 Langley Farms Dr SW is a home located in Gwinnett County with nearby schools including Trip Elementary School, Bay Creek Middle School, and Grayson High School.
Ownership History
Date
Name
Owned For
Owner Type
Purchase Details
Closed on
Aug 26, 2011
Sold by
Us Bank Na
Bought by
Simmons Angela D and Simmons Rushie H
Current Estimated Value
Home Financials for this Owner
Home Financials are based on the most recent Mortgage that was taken out on this home.
Original Mortgage
$177,507
Outstanding Balance
$116,143
Interest Rate
3.5%
Mortgage Type
FHA
Estimated Equity
$479,929
Purchase Details
Closed on
Aug 10, 2011
Sold by
Green Tree Servicing Llc
Bought by
Us Bank Na Trustee
Home Financials for this Owner
Home Financials are based on the most recent Mortgage that was taken out on this home.
Original Mortgage
$177,507
Outstanding Balance
$116,143
Interest Rate
3.5%
Mortgage Type
FHA
Estimated Equity
$479,929
Purchase Details
Closed on
Sep 1, 2009
Sold by
Shahid Imran
Bought by
Lin Steve and Lin Ling H
Purchase Details
Closed on
Mar 30, 2007
Sold by
Summer Homes Inc
Bought by
Mickens Ron M
Home Financials for this Owner
Home Financials are based on the most recent Mortgage that was taken out on this home.
Original Mortgage
$67,690
Interest Rate
6.11%
Mortgage Type
New Conventional
Create a Home Valuation Report for This Property
The Home Valuation Report is an in-depth analysis detailing your home's value as well as a comparison with similar homes in the area
Home Values in the Area
Average Home Value in this Area
Purchase History
| Date | Buyer | Sale Price | Title Company |
|---|---|---|---|
| Simmons Angela D | $185,000 | -- | |
| Us Bank Na Trustee | -- | -- | |
| Lin Steve | $37,500 | -- | |
| Green Tree Servicing Llc | $275,035 | -- | |
| Mickens Ron M | $338,500 | -- |
Source: Public Records
Mortgage History
| Date | Status | Borrower | Loan Amount |
|---|---|---|---|
| Open | Simmons Angela D | $177,507 | |
| Previous Owner | Mickens Ron M | $67,690 | |
| Previous Owner | Mickens Ron M | $270,760 |
Source: Public Records
Tax History Compared to Growth
Tax History
| Year | Tax Paid | Tax Assessment Tax Assessment Total Assessment is a certain percentage of the fair market value that is determined by local assessors to be the total taxable value of land and additions on the property. | Land | Improvement |
|---|---|---|---|---|
| 2025 | $9,621 | $263,600 | $30,000 | $233,600 |
| 2024 | $9,280 | $251,080 | $30,000 | $221,080 |
| 2023 | $9,280 | $191,560 | $28,000 | $163,560 |
| 2022 | $7,146 | $191,560 | $28,000 | $163,560 |
| 2021 | $5,724 | $149,040 | $23,200 | $125,840 |
| 2020 | $5,447 | $140,480 | $20,000 | $120,480 |
| 2019 | $5,245 | $140,480 | $20,000 | $120,480 |
| 2018 | $4,668 | $123,760 | $12,800 | $110,960 |
| 2016 | $4,456 | $117,280 | $12,800 | $104,480 |
| 2015 | $4,308 | $111,680 | $7,200 | $104,480 |
| 2014 | -- | $79,200 | $7,200 | $72,000 |
Source: Public Records
Map
Nearby Homes
- 3227 Hollowstone Dr
- 3370 Cooper Woods Dr
- 2868 Rolling Downs Way
- 727 Kestrel Dr
- 2949 Rosebud Rd
- 2434 Anhinga Dr
- 2474 Anhinga Dr
- 3115 Wellbrook Dr
- Stanford Plan at Lake Carlton
- 792 Cooper Rd
- 3385 Wellbrook Dr
- 3421 Palmer Dr
- 3421 Palmer Dr Unit 33
- 3423 Palmer Dr
- 3423 Palmer Dr Unit 34
- 3425 Palmer Dr Unit 35
- 3425 Palmer Dr
- 3427 Palmer Dr
- 3427 Palmer Dr Unit 36
- 3429 Palmer Dr
- 831 Langley Farms Dr
- 841 Langley Farms Dr Unit 29
- 841 Langley Farms Dr
- 821 Langley Farms Dr
- 830 Langley Farms Dr
- 820 Langley Farms Dr
- 851 Langley Farms Dr Unit 30
- 851 Langley Farms Dr
- 811 Langley Farms Dr
- 840 Langley Farms Dr
- 621 Langley Farms Dr
- 621 Langley Farms Dr Unit 15
- 810 Langley Farms Dr
- 631 Langley Farms Dr
- 611 Langley Farms Dr Unit 14
- 611 Langley Farms Dr
- 641 Langley Farms Dr
- 850 Langley Farms Dr
- 861 Langley Farms Dr
- 861 Langley Farms Dr Unit 31