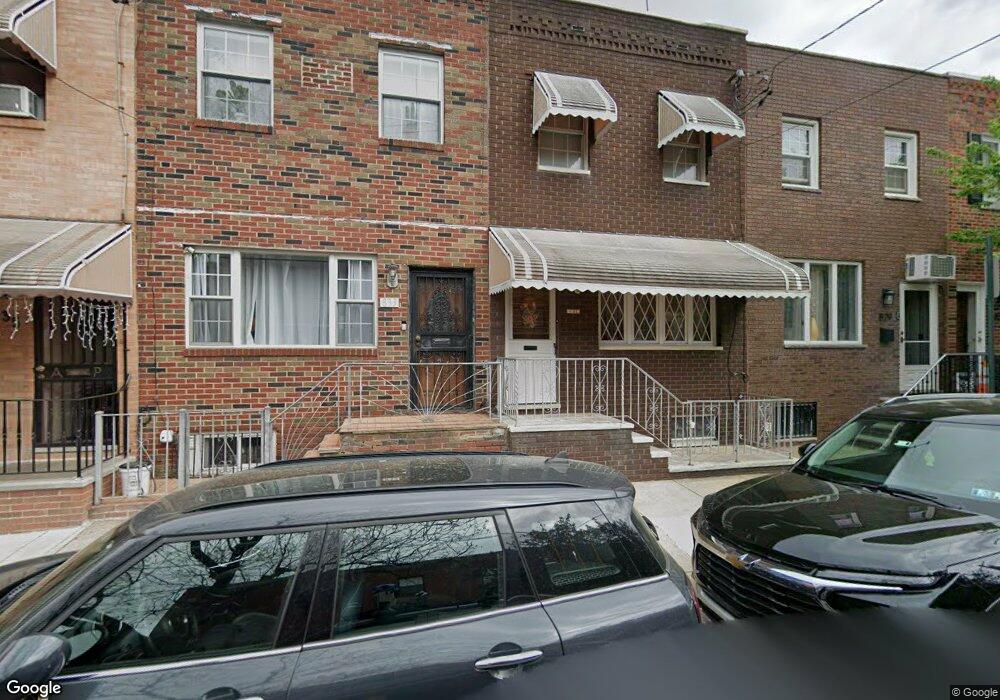
831 Moore St Philadelphia, PA 19148
East Passyunk NeighborhoodEstimated Value: $288,000 - $334,000
3
Beds
1
Bath
1,024
Sq Ft
$300/Sq Ft
Est. Value
About This Home
This home is located at 831 Moore St, Philadelphia, PA 19148 and is currently estimated at $307,651, approximately $300 per square foot. 831 Moore St is a home located in Philadelphia County with nearby schools including Southwark School, South Philadelphia High School, and Our Lady of Hope.
Ownership History
Date
Name
Owned For
Owner Type
Purchase Details
Closed on
Feb 14, 2009
Sold by
Capilli Tommasina and The Nicholas Capilli Revocable
Bought by
Dimento Rocco
Current Estimated Value
Purchase Details
Closed on
Dec 26, 2002
Sold by
Capilli Nicholas and Capilli Tommasina
Bought by
Capilli Nicholas and Capilli Tommasina
Purchase Details
Closed on
Aug 28, 2000
Sold by
Kalin Carmela and Dimento Rocco
Bought by
Capilli Nicholas and Capilli Tommasina
Purchase Details
Closed on
May 23, 2000
Sold by
Capilli Nicholas and Capilli Tommasina
Bought by
Kalin Carmela and Dimento Rocco
Create a Home Valuation Report for This Property
The Home Valuation Report is an in-depth analysis detailing your home's value as well as a comparison with similar homes in the area
Home Values in the Area
Average Home Value in this Area
Purchase History
| Date | Buyer | Sale Price | Title Company |
|---|---|---|---|
| Dimento Rocco | $21,937 | None Available | |
| Capilli Nicholas | -- | -- | |
| Capilli Nicholas | $30,643 | -- | |
| Kalin Carmela | $29,943 | -- |
Source: Public Records
Tax History Compared to Growth
Tax History
| Year | Tax Paid | Tax Assessment Tax Assessment Total Assessment is a certain percentage of the fair market value that is determined by local assessors to be the total taxable value of land and additions on the property. | Land | Improvement |
|---|---|---|---|---|
| 2025 | $1,503 | $278,700 | $55,740 | $222,960 |
| 2024 | $1,503 | $278,700 | $55,740 | $222,960 |
| 2023 | $1,503 | $247,000 | $49,400 | $197,600 |
| 2022 | $1,503 | $107,400 | $49,400 | $58,000 |
| 2021 | $1,503 | $0 | $0 | $0 |
| 2020 | $1,503 | $0 | $0 | $0 |
| 2019 | $1,503 | $0 | $0 | $0 |
| 2018 | $1,503 | $0 | $0 | $0 |
| 2017 | $1,503 | $0 | $0 | $0 |
| 2016 | $1,503 | $0 | $0 | $0 |
| 2015 | $1,425 | $0 | $0 | $0 |
| 2014 | -- | $185,900 | $15,840 | $170,060 |
| 2012 | -- | $11,456 | $2,075 | $9,381 |
Source: Public Records
Map
Nearby Homes