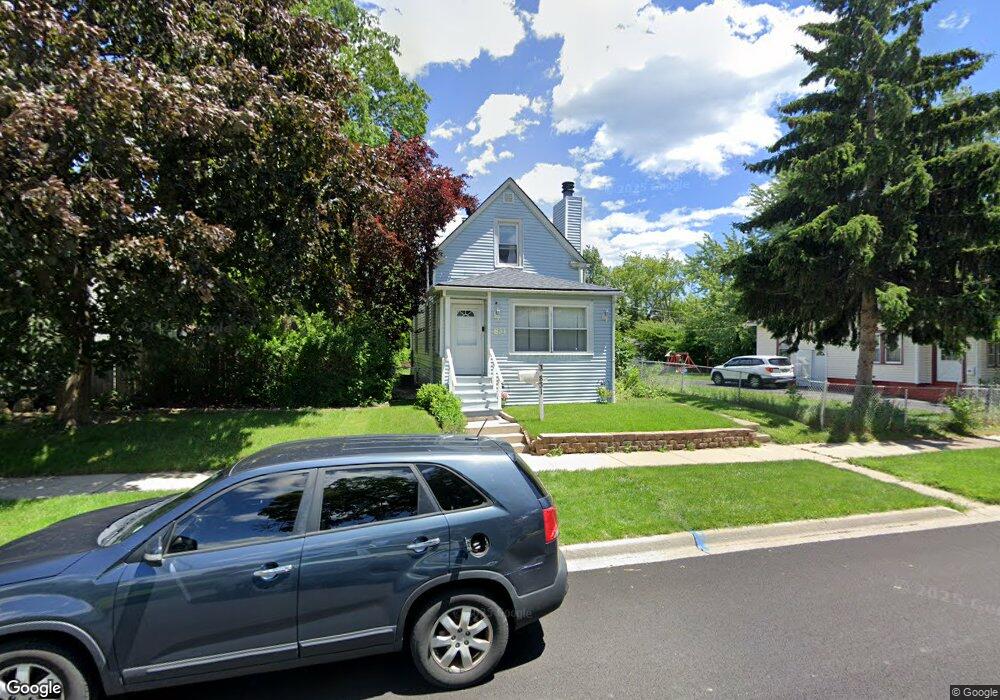
831 N Ash St Waukegan, IL 60085
Estimated Value: $151,000 - $207,000
3
Beds
1
Bath
1,069
Sq Ft
$176/Sq Ft
Est. Value
About This Home
This home is located at 831 N Ash St, Waukegan, IL 60085 and is currently estimated at $188,272, approximately $176 per square foot. 831 N Ash St is a home located in Lake County with nearby schools including Edith M Smith Middle School, Waukegan High School, and LEARN John & Kathy Schreiber Campus.
Ownership History
Date
Name
Owned For
Owner Type
Purchase Details
Closed on
Nov 17, 1994
Sold by
Sanchez Alejandro and Sanchez Maria S
Bought by
Sanchez Alejandro and Sanchez Maria S
Current Estimated Value
Home Financials for this Owner
Home Financials are based on the most recent Mortgage that was taken out on this home.
Original Mortgage
$68,500
Interest Rate
9%
Create a Home Valuation Report for This Property
The Home Valuation Report is an in-depth analysis detailing your home's value as well as a comparison with similar homes in the area
Home Values in the Area
Average Home Value in this Area
Purchase History
| Date | Buyer | Sale Price | Title Company |
|---|---|---|---|
| Sanchez Alejandro | -- | -- |
Source: Public Records
Mortgage History
| Date | Status | Borrower | Loan Amount |
|---|---|---|---|
| Closed | Sanchez Alejandro | $68,500 |
Source: Public Records
Tax History Compared to Growth
Tax History
| Year | Tax Paid | Tax Assessment Tax Assessment Total Assessment is a certain percentage of the fair market value that is determined by local assessors to be the total taxable value of land and additions on the property. | Land | Improvement |
|---|---|---|---|---|
| 2024 | $2,583 | $48,163 | $6,385 | $41,778 |
| 2023 | $3,231 | $43,393 | $5,716 | $37,677 |
| 2022 | $3,231 | $39,048 | $5,436 | $33,612 |
| 2021 | $2,887 | $33,687 | $4,850 | $28,837 |
| 2020 | $2,877 | $31,383 | $4,518 | $26,865 |
| 2019 | $2,843 | $28,757 | $4,140 | $24,617 |
| 2018 | $2,535 | $25,984 | $5,274 | $20,710 |
| 2017 | $2,417 | $22,989 | $4,666 | $18,323 |
| 2016 | $2,160 | $19,977 | $4,055 | $15,922 |
| 2015 | $2,007 | $17,879 | $3,629 | $14,250 |
| 2014 | $1,928 | $16,933 | $2,683 | $14,250 |
| 2012 | $2,609 | $18,344 | $2,906 | $15,438 |
Source: Public Records
Map
Nearby Homes
- 918 N Ash St
- 620 N Poplar St
- 702 Franklin St
- 415 W Ridgeland Ave
- 1110 N Ash St
- 522 N Poplar St
- 1122 N Ash St
- 325 4th St
- 723 N County St
- 917 N Linden Ave
- 511 Chestnut St
- 428 N Poplar St
- 452 North Ave
- 1109 Massena Ave
- 217 Stewart Ave
- 611 N Genesee St
- 1000 Pine St
- 1105 Woodlawn Cir
- 1336 N Ash St
- 1335 Chestnut St