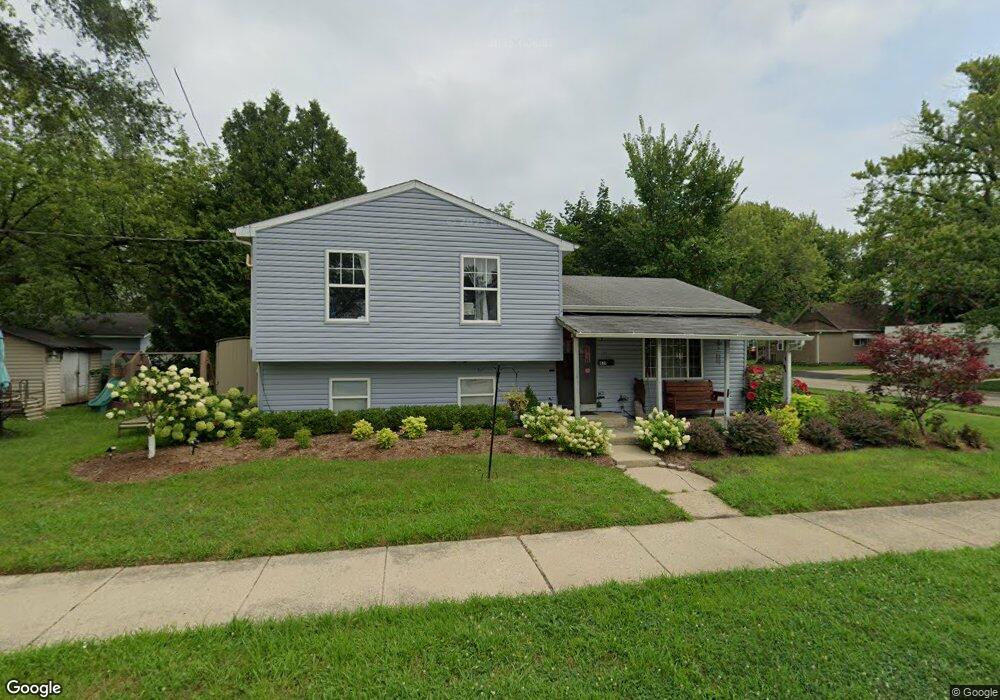
831 N Poplar St Waukegan, IL 60085
Estimated Value: $184,000 - $213,000
--
Bed
2
Baths
960
Sq Ft
$206/Sq Ft
Est. Value
About This Home
This home is located at 831 N Poplar St, Waukegan, IL 60085 and is currently estimated at $197,803, approximately $206 per square foot. 831 N Poplar St is a home located in Lake County with nearby schools including Glen Flora Elementary School, Edith M Smith Middle School, and Waukegan High School.
Ownership History
Date
Name
Owned For
Owner Type
Purchase Details
Closed on
Jun 9, 2006
Sold by
Maldonado Nelson
Bought by
Escobar Antonio B and Escobar Ana
Current Estimated Value
Home Financials for this Owner
Home Financials are based on the most recent Mortgage that was taken out on this home.
Original Mortgage
$118,750
Outstanding Balance
$70,244
Interest Rate
6.68%
Mortgage Type
Purchase Money Mortgage
Estimated Equity
$127,559
Purchase Details
Closed on
Sep 10, 1999
Sold by
Baig Rasheed M
Bought by
Maldonado Nelson and Murillo Eleazar
Home Financials for this Owner
Home Financials are based on the most recent Mortgage that was taken out on this home.
Original Mortgage
$120,370
Interest Rate
7.93%
Mortgage Type
FHA
Purchase Details
Closed on
Apr 21, 1999
Sold by
Cervantes Reynaldo
Bought by
Baig Rasheed M
Purchase Details
Closed on
Jul 29, 1998
Sold by
Johnson Maki William E and Johnson Maki Ruth
Bought by
Cervantes Reynaldo
Create a Home Valuation Report for This Property
The Home Valuation Report is an in-depth analysis detailing your home's value as well as a comparison with similar homes in the area
Home Values in the Area
Average Home Value in this Area
Purchase History
| Date | Buyer | Sale Price | Title Company |
|---|---|---|---|
| Escobar Antonio B | $125,000 | Ticor | |
| Maldonado Nelson | $122,000 | -- | |
| Baig Rasheed M | $25,000 | Ticor Title | |
| Cervantes Reynaldo | $5,000 | -- |
Source: Public Records
Mortgage History
| Date | Status | Borrower | Loan Amount |
|---|---|---|---|
| Open | Escobar Antonio B | $118,750 | |
| Previous Owner | Maldonado Nelson | $120,370 |
Source: Public Records
Tax History Compared to Growth
Tax History
| Year | Tax Paid | Tax Assessment Tax Assessment Total Assessment is a certain percentage of the fair market value that is determined by local assessors to be the total taxable value of land and additions on the property. | Land | Improvement |
|---|---|---|---|---|
| 2024 | $4,485 | $61,667 | $8,128 | $53,539 |
| 2023 | $4,969 | $55,562 | $7,277 | $48,285 |
| 2022 | $4,969 | $56,831 | $6,921 | $49,910 |
| 2021 | $4,696 | $51,038 | $6,174 | $44,864 |
| 2020 | $4,710 | $47,548 | $5,752 | $41,796 |
| 2019 | $4,687 | $43,570 | $5,271 | $38,299 |
| 2018 | $4,974 | $44,854 | $6,714 | $38,140 |
| 2017 | $4,791 | $39,683 | $5,940 | $33,743 |
| 2016 | $4,402 | $34,483 | $5,162 | $29,321 |
| 2015 | $4,200 | $30,863 | $4,620 | $26,243 |
| 2014 | $2,818 | $22,192 | $3,833 | $18,359 |
| 2012 | $3,712 | $24,044 | $4,153 | $19,891 |
Source: Public Records
Map
Nearby Homes
- 918 N Ash St
- 620 N Poplar St
- 702 Franklin St
- 522 N Poplar St
- 917 N Linden Ave
- 1110 N Ash St
- 1109 Massena Ave
- 415 W Ridgeland Ave
- 511 Chestnut St
- 428 N Poplar St
- 325 4th St
- 452 North Ave
- 1000 Pine St
- 723 N County St
- 1105 Woodlawn Cir
- 824 N Butrick St
- 1335 Chestnut St
- 1336 N Ash St
- 426 Julian St
- 1312 N Linden Ave