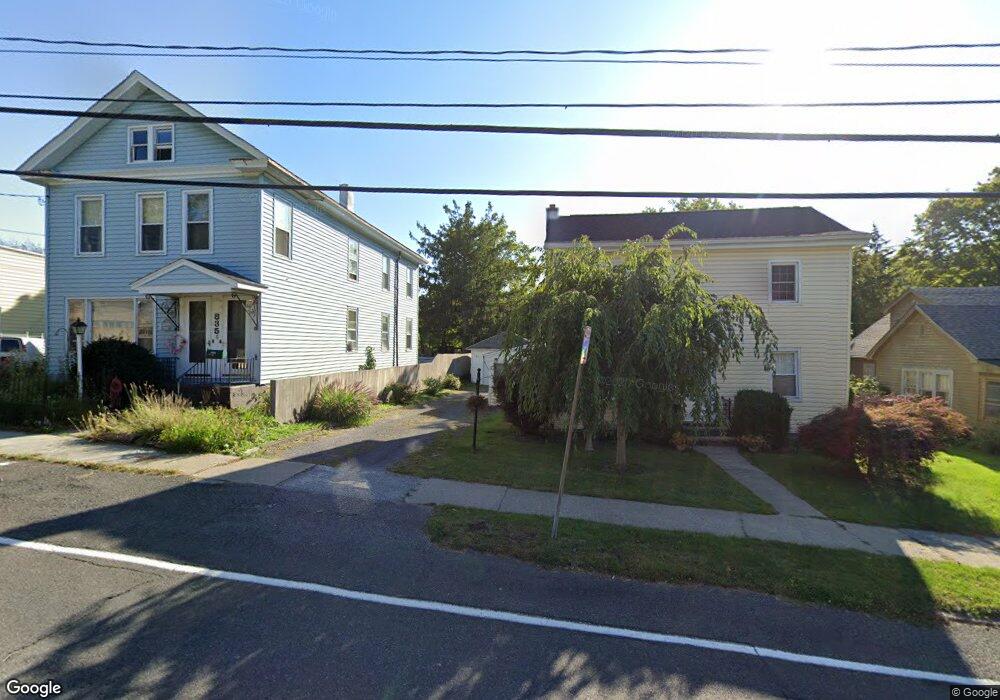
831 Union St Unit 833 Hudson, NY 12534
Estimated Value: $267,000 - $532,168
3
Beds
2
Baths
1,500
Sq Ft
$293/Sq Ft
Est. Value
About This Home
This home is located at 831 Union St Unit 833, Hudson, NY 12534 and is currently estimated at $439,792, approximately $293 per square foot. 831 Union St Unit 833 is a home located in Columbia County with nearby schools including Montgomery C. Smith Elementary School and Hudson Senior High School.
Ownership History
Date
Name
Owned For
Owner Type
Purchase Details
Closed on
Oct 26, 2017
Sold by
Harvey Martha and Northrop Holly S
Bought by
Leoni Jerald and Leoni Susan H
Current Estimated Value
Home Financials for this Owner
Home Financials are based on the most recent Mortgage that was taken out on this home.
Original Mortgage
$239,760
Outstanding Balance
$198,730
Interest Rate
3.83%
Mortgage Type
Purchase Money Mortgage
Estimated Equity
$241,062
Purchase Details
Closed on
Jun 15, 2006
Sold by
Polidor Thomas
Bought by
Harvey Martha A
Create a Home Valuation Report for This Property
The Home Valuation Report is an in-depth analysis detailing your home's value as well as a comparison with similar homes in the area
Home Values in the Area
Average Home Value in this Area
Purchase History
| Date | Buyer | Sale Price | Title Company |
|---|---|---|---|
| Leoni Jerald | $299,700 | -- | |
| Harvey Martha A | $185,000 | Alyson Atwood |
Source: Public Records
Mortgage History
| Date | Status | Borrower | Loan Amount |
|---|---|---|---|
| Open | Leoni Jerald | $239,760 |
Source: Public Records
Tax History Compared to Growth
Tax History
| Year | Tax Paid | Tax Assessment Tax Assessment Total Assessment is a certain percentage of the fair market value that is determined by local assessors to be the total taxable value of land and additions on the property. | Land | Improvement |
|---|---|---|---|---|
| 2024 | $3,636 | $300,000 | $30,400 | $269,600 |
| 2023 | $6,323 | $300,000 | $30,400 | $269,600 |
| 2022 | $5,817 | $300,000 | $30,400 | $269,600 |
| 2021 | $5,225 | $300,000 | $30,400 | $269,600 |
| 2020 | $5,325 | $300,000 | $30,400 | $269,600 |
| 2019 | $5,032 | $300,000 | $30,400 | $269,600 |
| 2018 | $5,032 | $250,000 | $43,000 | $207,000 |
| 2017 | $2,290 | $152,000 | $43,000 | $109,000 |
| 2016 | $2,168 | $152,000 | $43,000 | $109,000 |
| 2015 | -- | $152,000 | $43,000 | $109,000 |
| 2014 | -- | $152,000 | $43,000 | $109,000 |
Source: Public Records
Map
Nearby Homes