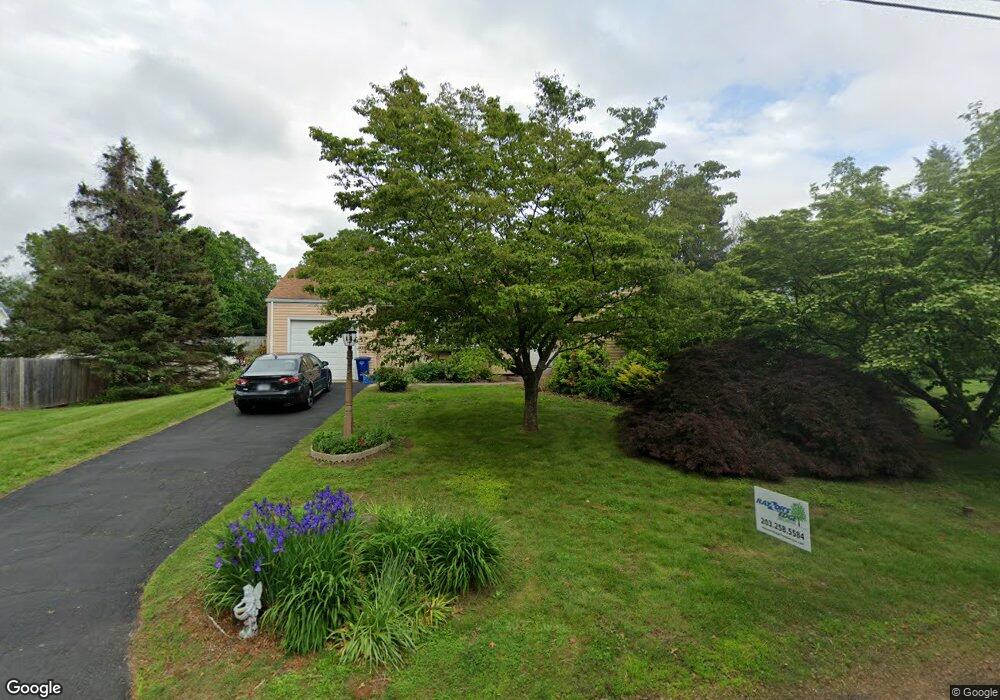
831 Woodruff Rd Orange, CT 06477
Estimated Value: $415,413 - $500,000
3
Beds
2
Baths
1,465
Sq Ft
$307/Sq Ft
Est. Value
About This Home
This home is located at 831 Woodruff Rd, Orange, CT 06477 and is currently estimated at $449,353, approximately $306 per square foot. 831 Woodruff Rd is a home located in New Haven County with nearby schools including Mary L. Tracy School, Race Brook School, and Amity Middle School: Orange.
Ownership History
Date
Name
Owned For
Owner Type
Purchase Details
Closed on
Jan 24, 1989
Sold by
Poole Frederick A
Bought by
Wynne Edward F
Current Estimated Value
Home Financials for this Owner
Home Financials are based on the most recent Mortgage that was taken out on this home.
Original Mortgage
$160,000
Interest Rate
10.38%
Mortgage Type
Purchase Money Mortgage
Create a Home Valuation Report for This Property
The Home Valuation Report is an in-depth analysis detailing your home's value as well as a comparison with similar homes in the area
Home Values in the Area
Average Home Value in this Area
Purchase History
| Date | Buyer | Sale Price | Title Company |
|---|---|---|---|
| Wynne Edward F | $190,000 | -- |
Source: Public Records
Mortgage History
| Date | Status | Borrower | Loan Amount |
|---|---|---|---|
| Closed | Wynne Edward F | $40,000 | |
| Closed | Wynne Edward F | $150,000 | |
| Closed | Wynne Edward F | $160,000 | |
| Previous Owner | Wynne Edward F | $75,000 |
Source: Public Records
Tax History
| Year | Tax Paid | Tax Assessment Tax Assessment Total Assessment is a certain percentage of the fair market value that is determined by local assessors to be the total taxable value of land and additions on the property. | Land | Improvement |
|---|---|---|---|---|
| 2025 | $6,527 | $224,300 | $117,300 | $107,000 |
| 2024 | $6,953 | $224,300 | $117,300 | $107,000 |
| 2023 | $5,144 | $159,200 | $85,700 | $73,500 |
| 2022 | $5,207 | $159,200 | $85,700 | $73,500 |
| 2021 | $5,293 | $159,200 | $85,700 | $73,500 |
| 2020 | $5,212 | $159,200 | $85,700 | $73,500 |
| 2019 | $5,188 | $159,200 | $85,700 | $73,500 |
| 2018 | $5,094 | $159,200 | $85,700 | $73,500 |
| 2017 | $4,965 | $149,200 | $80,900 | $68,300 |
| 2016 | $4,804 | $149,200 | $80,900 | $68,300 |
| 2015 | $4,685 | $149,200 | $80,900 | $68,300 |
| 2014 | $4,551 | $149,200 | $80,900 | $68,300 |
Source: Public Records
Map
Nearby Homes
Your Personal Tour Guide
Ask me questions while you tour the home.