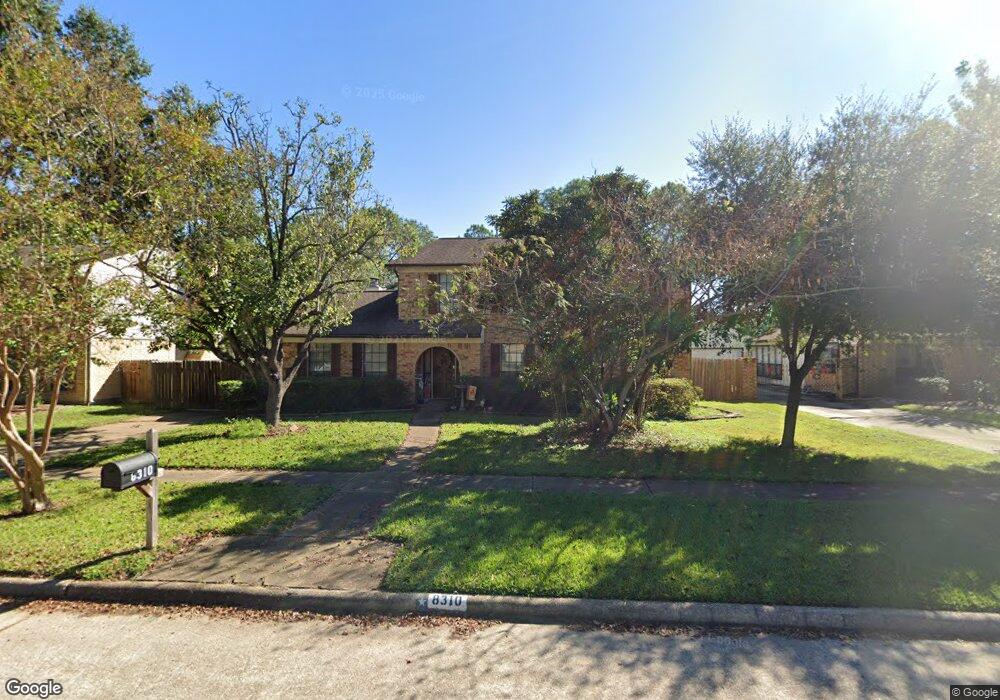
8310 Clover Gardens Dr Houston, TX 77095
Copperfield NeighborhoodEstimated Value: $278,234 - $308,000
4
Beds
3
Baths
2,000
Sq Ft
$147/Sq Ft
Est. Value
About This Home
This home is located at 8310 Clover Gardens Dr, Houston, TX 77095 and is currently estimated at $294,059, approximately $147 per square foot. 8310 Clover Gardens Dr is a home located in Harris County with nearby schools including Fiest Elementary School, Labay Middle School, and Cypress Falls High School.
Ownership History
Date
Name
Owned For
Owner Type
Purchase Details
Closed on
Mar 11, 2010
Sold by
The Bank Of New York Mellon
Bought by
Rankin Lori and Dohrer Philip
Current Estimated Value
Home Financials for this Owner
Home Financials are based on the most recent Mortgage that was taken out on this home.
Original Mortgage
$79,200
Interest Rate
5%
Mortgage Type
New Conventional
Purchase Details
Closed on
Nov 3, 2009
Sold by
Castiblanco German and Castiblanco Rosa
Bought by
The Bank Of New York Mellon and The Bank Of New York
Purchase Details
Closed on
Feb 1, 2000
Sold by
Sigmund James M and Sigmund Theresa A
Bought by
Castiblanco German and Castiblanco Rosa
Home Financials for this Owner
Home Financials are based on the most recent Mortgage that was taken out on this home.
Original Mortgage
$113,700
Interest Rate
7.95%
Create a Home Valuation Report for This Property
The Home Valuation Report is an in-depth analysis detailing your home's value as well as a comparison with similar homes in the area
Home Values in the Area
Average Home Value in this Area
Purchase History
| Date | Buyer | Sale Price | Title Company |
|---|---|---|---|
| Rankin Lori | -- | First American Title | |
| The Bank Of New York Mellon | $100,240 | None Available | |
| Castiblanco German | -- | American Title Co |
Source: Public Records
Mortgage History
| Date | Status | Borrower | Loan Amount |
|---|---|---|---|
| Previous Owner | Rankin Lori | $79,200 | |
| Previous Owner | Castiblanco German | $113,700 |
Source: Public Records
Tax History Compared to Growth
Tax History
| Year | Tax Paid | Tax Assessment Tax Assessment Total Assessment is a certain percentage of the fair market value that is determined by local assessors to be the total taxable value of land and additions on the property. | Land | Improvement |
|---|---|---|---|---|
| 2025 | $1,706 | $245,000 | $75,600 | $169,400 |
| 2024 | $1,706 | $247,643 | $75,600 | $172,043 |
| 2023 | $1,706 | $258,670 | $75,600 | $183,070 |
| 2022 | $4,674 | $223,000 | $54,000 | $169,000 |
| 2021 | $4,485 | $182,000 | $54,000 | $128,000 |
| 2020 | $4,218 | $155,817 | $45,000 | $110,817 |
| 2019 | $4,600 | $170,675 | $27,000 | $143,675 |
| 2018 | $1,188 | $150,000 | $27,000 | $123,000 |
| 2017 | $4,586 | $164,450 | $27,000 | $137,450 |
| 2016 | $4,402 | $164,450 | $27,000 | $137,450 |
| 2015 | $2,034 | $145,772 | $27,000 | $118,772 |
| 2014 | $2,034 | $130,675 | $27,000 | $103,675 |
Source: Public Records
Map
Nearby Homes
- 15339 Glenwood Park Dr
- 8211 Riverglade Dr
- 15010 Chetland Place Dr
- 15131 New Hastings Dr
- 15362 Meadow Village Dr
- 15611 Meadow Village Dr
- 15415 Swan Creek Dr
- 15414 Swan Creek Dr
- 14919 Forest Trails Dr
- 8203 Green Devon Dr
- 14962 Royal Birkdale St
- 14931 Inverrary Dr
- Highway 6 N & Huffmeister Rd
- 7827 Alamar Dr
- 14911 Sandalfoot St
- 15634 Haleys Landing Ln
- 8526 Greenleaf Lake Dr
- 8043 Oceanside Dr
- 15610 Tarpon Springs Ct
- 7731 Club Lake Dr
- 8306 Clover Gardens Dr
- 8314 Clover Gardens Dr
- 8302 Clover Gardens Dr
- 8318 Clover Gardens Dr
- 8307 Clover Gardens Dr
- 8311 Clover Gardens Dr
- 8303 Clover Gardens Dr
- 8222 Clover Gardens Dr
- 8315 Clover Gardens Dr
- 8322 Clover Gardens Dr
- 8223 Clover Gardens Dr
- 8319 Clover Gardens Dr
- 8218 Clover Gardens Dr
- 15314 Glenwood Park Dr
- 8326 Clover Gardens Dr
- 8219 Clover Gardens Dr
- 15310 Glenwood Park Dr
- 15318 Glenwood Park Dr
- 15306 Glenwood Park Dr
- 8323 Clover Gardens Dr