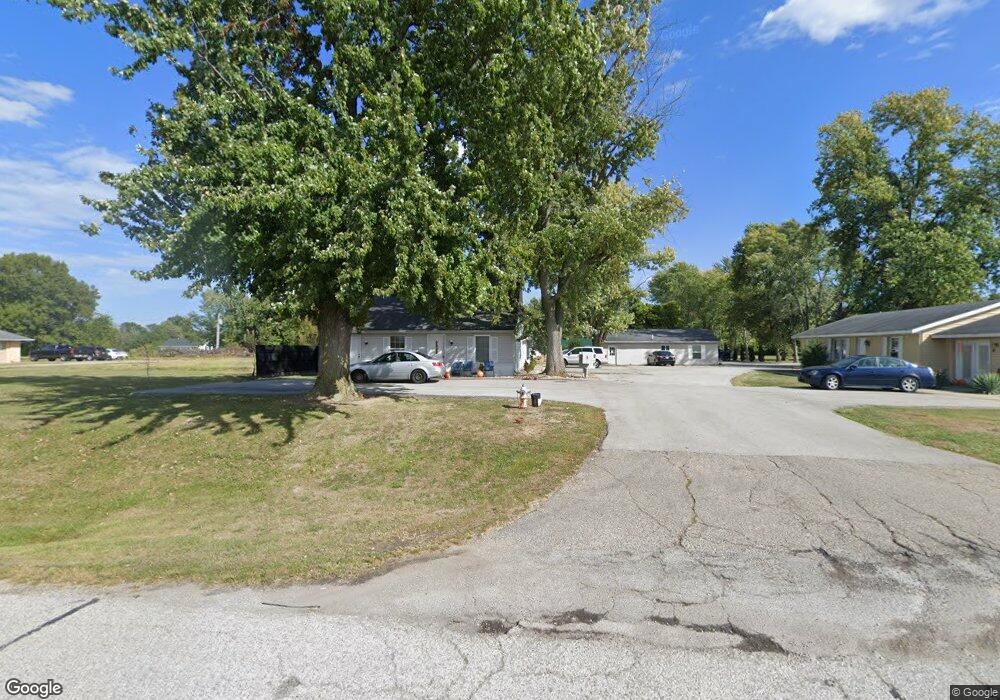
8310 S Us Highway 41 Terre Haute, IN 47802
Estimated Value: $138,000 - $847,774
3
Beds
2
Baths
1,534
Sq Ft
$258/Sq Ft
Est. Value
About This Home
Cute 1 bedroom / 1 bathroom unit in Ivyland Apartment complex, across from Ivy Tech on South 41.
Rent is $650 a month, plus approved tenant pays the electric.
To view the unit, you would have to come to the office and sign out the keys to take a look at the unit. We are located between Boot City and Pat's Cafe, O'Kelley Inc. We are here M-F 8-4 pm, closed on the weekends. There is a $50 application fee, everyone 18 and over has to complete the application, criminal background, credit check, and previous rental reference check and be approved.
We do allow pets, ONE dog up to 20 lbs, FULL GROWN, or ONE cat, they are an additional $50 a month, and $100 of the deposit is non-refundable.
Ownership History
Date
Name
Owned For
Owner Type
Purchase Details
Closed on
Jul 24, 2018
Sold by
Kelley Rodney E O
Bought by
O Kelley Land Development Inc
Current Estimated Value
Purchase Details
Closed on
Sep 19, 2017
Sold by
Kelley Rodney E O and Kelley Rodney O
Bought by
Kelley Rodney E O and Rodney E O Kelley Living Trust
Purchase Details
Closed on
Sep 26, 2013
Sold by
Southside Rentals Llc
Bought by
O Kelley Land Development Inc
Create a Home Valuation Report for This Property
The Home Valuation Report is an in-depth analysis detailing your home's value as well as a comparison with similar homes in the area
Home Values in the Area
Average Home Value in this Area
Purchase History
| Date | Buyer | Sale Price | Title Company |
|---|---|---|---|
| O Kelley Land Development Inc | -- | None Available | |
| Okelley Rodney E | -- | None Available | |
| Kelley Rodney E O | -- | None Available | |
| Okelley Rodney E | -- | None Available | |
| O Kelley Land Development Inc | -- | None Available |
Source: Public Records
Property History
| Date | Event | Price | List to Sale | Price per Sq Ft |
|---|---|---|---|---|
| 02/10/2025 02/10/25 | Off Market | -- | -- | -- |
| 01/17/2025 01/17/25 | For Rent | -- | -- | -- |
Tax History Compared to Growth
Tax History
| Year | Tax Paid | Tax Assessment Tax Assessment Total Assessment is a certain percentage of the fair market value that is determined by local assessors to be the total taxable value of land and additions on the property. | Land | Improvement |
|---|---|---|---|---|
| 2024 | $18,450 | $853,300 | $120,300 | $733,000 |
| 2023 | $19,983 | $924,300 | $120,300 | $804,000 |
| 2022 | $20,299 | $938,800 | $120,300 | $818,500 |
| 2021 | $19,055 | $881,300 | $122,800 | $758,500 |
| 2020 | $21,190 | $980,000 | $122,800 | $857,200 |
| 2019 | $21,459 | $978,800 | $122,800 | $856,000 |
| 2018 | $26,076 | $869,200 | $119,200 | $750,000 |
| 2017 | $16,814 | $840,700 | $109,700 | $731,000 |
| 2016 | $16,140 | $807,000 | $105,200 | $701,800 |
| 2014 | $16,665 | $831,200 | $104,200 | $727,000 |
| 2013 | $16,665 | $810,000 | $101,500 | $708,500 |
Source: Public Records
Map
Nearby Homes
- 8449 Bono Rd
- 1901 E Buena Vista Dr
- 1908 E Lexington Dr
- 1286 E Elmwood Dr
- 1311 E Garden Dr
- 1299 E Garden Dr
- 37 Doe Ct
- 1869 E Crystal Creek Dr
- 1642 E Crystal Creek Dr
- 7530 S Carlisle St
- 250 Southridge Rd
- 7634 S Mount Vernon St
- 913 E Monticello Dr
- 7975 Marblehead Ct
- 35 Ridgecrest Ct
- 7435 S Ellenwood St
- 33 S Crescent St
- 31 E Gateway Dr
- 111 E Southglen Dr
- 7401 S Pine Hill St
- 8310 S Us Highway 41 Unit 8310 A
- 8310 S Us Highway 41
- 8270 S Us Highway 41
- 8362 S Us Highway 41
- 8354 S Us Highway 41 Unit B
- 8382 S Us Highway 41
- 8219 Bono Rd
- 8251 Bono Rd
- 8420 S Us Highway 41
- 8319 Bono Rd
- 8420 S Us Hwy 41 Unit A
- 8406 S Us Highway 41 Unit A
- 8281 Bono Rd
- 8450 S Us Highway 41
- 8201 Bono Rd
- 8355 Bono Rd
- 8337 Bono Rd
- 8175 Bono Rd
- 8175 Bono Rd
- 8240 Bono Rd