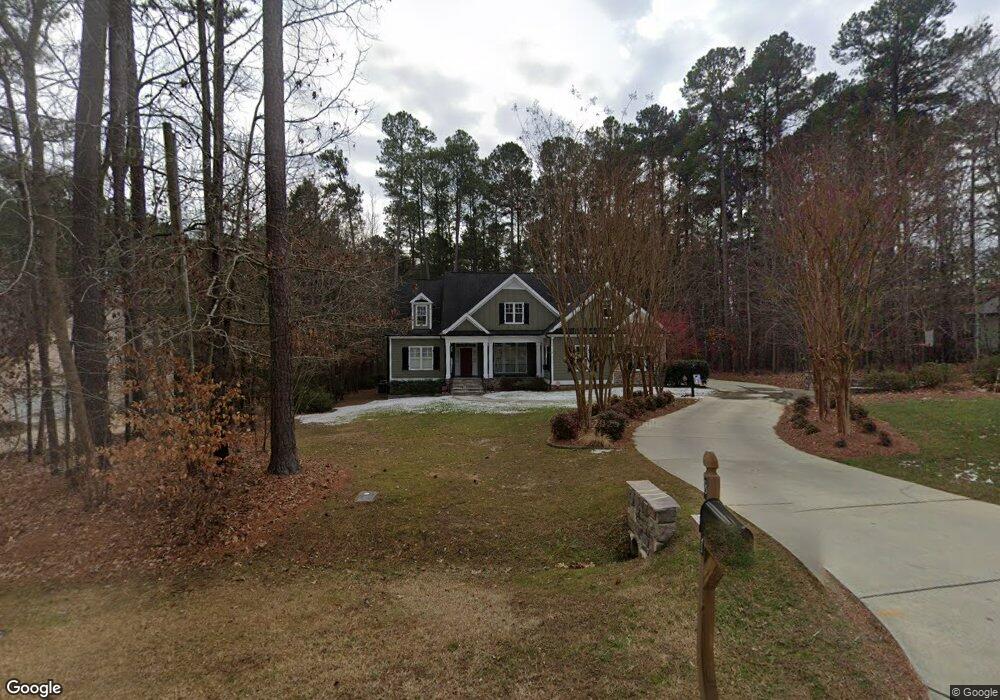
8311 Massey Chapel Rd Durham, NC 27713
Estimated Value: $568,000 - $932,000
4
Beds
3
Baths
2,700
Sq Ft
$290/Sq Ft
Est. Value
About This Home
This home is located at 8311 Massey Chapel Rd, Durham, NC 27713 and is currently estimated at $784,110, approximately $290 per square foot. 8311 Massey Chapel Rd is a home located in Durham County with nearby schools including Lowe's Grove Middle, Hillside High School, and AL Huda Academy.
Ownership History
Date
Name
Owned For
Owner Type
Purchase Details
Closed on
Oct 22, 2004
Sold by
Zenith Homes Co
Bought by
Avinger Randy A and Avinger Tracey C
Current Estimated Value
Home Financials for this Owner
Home Financials are based on the most recent Mortgage that was taken out on this home.
Original Mortgage
$157,000
Outstanding Balance
$76,343
Interest Rate
5.5%
Mortgage Type
Purchase Money Mortgage
Estimated Equity
$707,767
Purchase Details
Closed on
May 4, 2004
Sold by
Goel Azad B and Goel Neera
Bought by
Zenith Homes Co
Home Financials for this Owner
Home Financials are based on the most recent Mortgage that was taken out on this home.
Original Mortgage
$65,031
Interest Rate
5.49%
Mortgage Type
Construction
Purchase Details
Closed on
Aug 18, 1999
Sold by
Pendergraft Franklin O and Pendergraft Lynn K
Bought by
Goel Azad B
Home Financials for this Owner
Home Financials are based on the most recent Mortgage that was taken out on this home.
Original Mortgage
$30,500
Interest Rate
7.65%
Create a Home Valuation Report for This Property
The Home Valuation Report is an in-depth analysis detailing your home's value as well as a comparison with similar homes in the area
Home Values in the Area
Average Home Value in this Area
Purchase History
| Date | Buyer | Sale Price | Title Company |
|---|---|---|---|
| Avinger Randy A | $327,000 | -- | |
| Zenith Homes Co | $64,000 | -- | |
| Goel Azad B | $40,500 | -- |
Source: Public Records
Mortgage History
| Date | Status | Borrower | Loan Amount |
|---|---|---|---|
| Open | Avinger Randy A | $157,000 | |
| Previous Owner | Zenith Homes Co | $65,031 | |
| Previous Owner | Goel Azad B | $30,500 |
Source: Public Records
Tax History Compared to Growth
Tax History
| Year | Tax Paid | Tax Assessment Tax Assessment Total Assessment is a certain percentage of the fair market value that is determined by local assessors to be the total taxable value of land and additions on the property. | Land | Improvement |
|---|---|---|---|---|
| 2025 | $5,454 | $797,585 | $178,000 | $619,585 |
| 2024 | $2,019 | $507,979 | $66,712 | $441,267 |
| 2023 | $4,855 | $507,979 | $66,712 | $441,267 |
| 2022 | $4,716 | $507,979 | $66,712 | $441,267 |
| 2021 | $4,455 | $507,979 | $66,712 | $441,267 |
| 2020 | $4,354 | $507,979 | $66,712 | $441,267 |
| 2019 | $4,303 | $507,979 | $66,712 | $441,267 |
| 2018 | $3,266 | $353,818 | $80,055 | $273,763 |
| 2017 | $3,160 | $353,818 | $80,055 | $273,763 |
| 2016 | $3,062 | $353,818 | $80,055 | $273,763 |
| 2015 | $3,445 | $358,101 | $66,700 | $291,401 |
| 2014 | $3,386 | $358,101 | $66,700 | $291,401 |
Source: Public Records
Map
Nearby Homes
- 1612 Timber Wolf Dr
- 1118 Scholastic Cir
- 1217 Great Egret Way
- 1416 Southpoint Trail
- 1604 Timber Wolf Dr
- 519 Hunting Chase
- 8027 Sundance Cir
- 8424 Eagle View Dr
- 8017 Morrell Ln
- 1215 Bellenden Dr
- 7502 Hedfield Way
- 107 Alumni Ave
- 142 College Ave
- 1040 Bellenden Dr
- 316 Academia Ct
- 8115 Massey Chapel Rd
- 233 S Bend Dr
- 203 S Bend Dr
- 204 S Bend Dr
- 2113 Pitchfork Ln
- 8307 Massey Chapel Rd
- 3 Bland Spring Place
- 8303 Massey Chapel Rd
- 8312 Massey Chapel Rd
- 8308 Massey Chapel Rd
- 5 Bland Spring Place
- 104 Norcross Rd
- 0 Bland Spring Place Unit 1823728
- 0 Bland Spring Place Unit 6 TR1823728
- 0 Bland Spring Place Unit 6
- 2 Oakwind Ct
- 7 Bland Spring Place
- 3 Oakwind Ct
- 103 Norcross Rd
- 8250 Massey Chapel Rd
- 9 Bland Spring Place
- 4 Oakwind Ct
- 8 Bland Spring Place
- 5 Oakwind Ct
- 11 Bland Spring Place