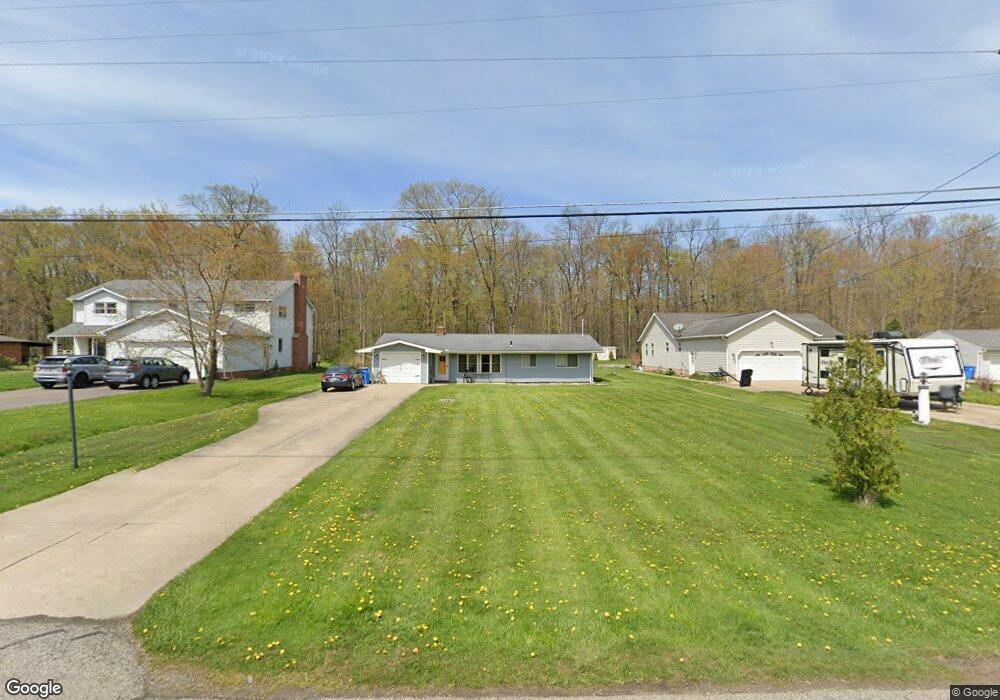
8312 Sharp Ln Chesterland, OH 44026
Estimated Value: $172,000 - $242,000
3
Beds
1
Bath
1,208
Sq Ft
$174/Sq Ft
Est. Value
About This Home
This home is located at 8312 Sharp Ln, Chesterland, OH 44026 and is currently estimated at $210,694, approximately $174 per square foot. 8312 Sharp Ln is a home located in Geauga County with nearby schools including West Geauga High School and St Anselm School.
Ownership History
Date
Name
Owned For
Owner Type
Purchase Details
Closed on
Nov 9, 2020
Sold by
Milnar Eric F and Milnar Andrea M
Bought by
Stumpf Jonathan
Current Estimated Value
Home Financials for this Owner
Home Financials are based on the most recent Mortgage that was taken out on this home.
Original Mortgage
$129,883
Outstanding Balance
$114,211
Interest Rate
2.9%
Mortgage Type
New Conventional
Estimated Equity
$96,483
Purchase Details
Closed on
Aug 30, 2004
Sold by
Milnar Eric F and Milnar Andrea M
Bought by
Milnar Eric F and Milnar Andrea M
Purchase Details
Closed on
Mar 10, 2004
Sold by
Holder G Michael
Bought by
Milnar Eric F
Home Financials for this Owner
Home Financials are based on the most recent Mortgage that was taken out on this home.
Original Mortgage
$99,750
Interest Rate
5.77%
Mortgage Type
Fannie Mae Freddie Mac
Purchase Details
Closed on
Oct 6, 2003
Sold by
Estate Of Lillian R Holder
Bought by
Holder Bill E
Purchase Details
Closed on
Jan 1, 1990
Bought by
Holder Bill E
Create a Home Valuation Report for This Property
The Home Valuation Report is an in-depth analysis detailing your home's value as well as a comparison with similar homes in the area
Home Values in the Area
Average Home Value in this Area
Purchase History
| Date | Buyer | Sale Price | Title Company |
|---|---|---|---|
| Stumpf Jonathan | $133,900 | None Available | |
| Milnar Eric F | -- | -- | |
| Milnar Eric F | $105,000 | Chicago Title Insurance Co | |
| Holder Bill E | -- | -- | |
| Holder Bill E | -- | -- |
Source: Public Records
Mortgage History
| Date | Status | Borrower | Loan Amount |
|---|---|---|---|
| Open | Stumpf Jonathan | $129,883 | |
| Previous Owner | Milnar Eric F | $99,750 |
Source: Public Records
Tax History
| Year | Tax Paid | Tax Assessment Tax Assessment Total Assessment is a certain percentage of the fair market value that is determined by local assessors to be the total taxable value of land and additions on the property. | Land | Improvement |
|---|---|---|---|---|
| 2025 | $2,436 | $54,080 | $11,870 | $42,210 |
| 2024 | $2,436 | $54,080 | $11,870 | $42,210 |
| 2023 | $2,333 | $54,080 | $11,870 | $42,210 |
| 2022 | $1,748 | $34,760 | $9,870 | $24,890 |
| 2021 | $1,742 | $34,760 | $9,870 | $24,890 |
| 2020 | $1,811 | $34,760 | $9,870 | $24,890 |
| 2019 | $1,698 | $31,500 | $9,870 | $21,630 |
| 2018 | $1,685 | $31,500 | $9,870 | $21,630 |
| 2017 | $1,698 | $31,500 | $9,870 | $21,630 |
| 2016 | $1,587 | $27,830 | $9,450 | $18,380 |
| 2015 | $1,470 | $27,830 | $9,450 | $18,380 |
| 2014 | $1,470 | $27,830 | $9,450 | $18,380 |
| 2013 | $1,480 | $27,830 | $9,450 | $18,380 |
Source: Public Records
Map
Nearby Homes
- 8367 Kirkwood Dr
- 10831 Chillicothe Rd
- VL Palomino Trail
- 10900 Angela Dr
- 10899 Tibbetts Rd
- 8051 Euclid Chardon Rd
- 10405 Chillicothe Rd
- 10640 Bayshire Trail
- 7454 Euclid Chardon Rd
- 10548 Briar Hill Dr
- 11892 E Hill Dr
- 11765 Sherwood Trail
- 7139 Mulberry Rd
- 8301 Sherman Rd
- 9735 Chillicothe Rd Unit 54
- 9735 Chillicothe Rd Unit 26
- 9735 Chillicothe Rd Unit 30
- 7959 Battles Rd
- 8323 Eagle Rd Unit 52
- 8323 Eagle Rd Unit 44
Your Personal Tour Guide
Ask me questions while you tour the home.