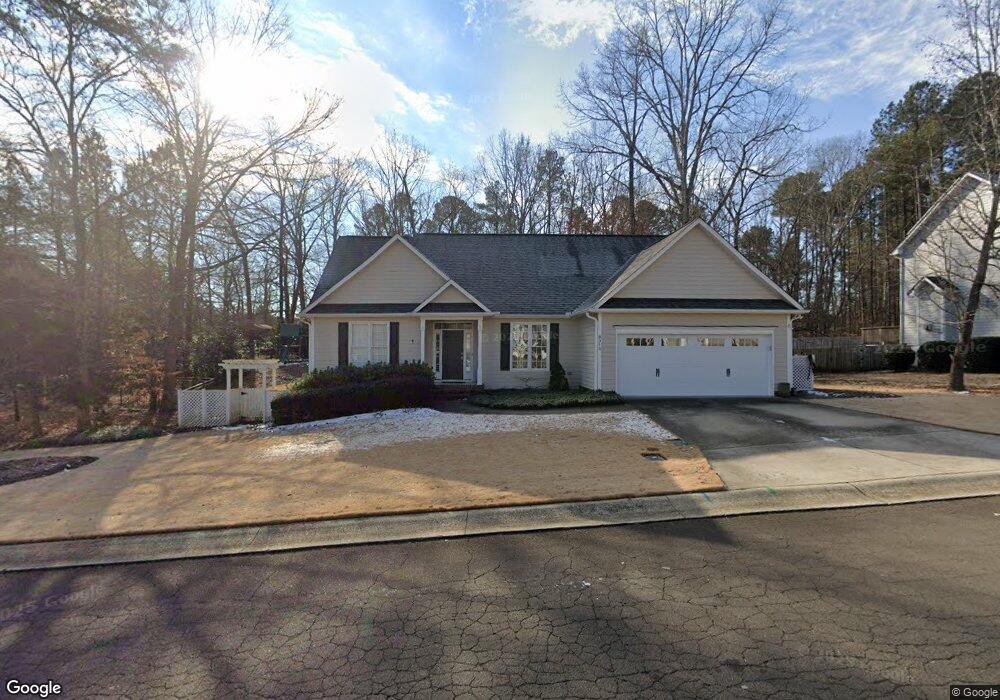
8315 Buck Crossing Dr Durham, NC 27713
Southpoint NeighborhoodEstimated Value: $594,806 - $642,000
4
Beds
3
Baths
2,380
Sq Ft
$263/Sq Ft
Est. Value
About This Home
This home is located at 8315 Buck Crossing Dr, Durham, NC 27713 and is currently estimated at $625,202, approximately $262 per square foot. 8315 Buck Crossing Dr is a home located in Durham County with nearby schools including Lowe's Grove Middle, Hillside High School, and AL Huda Academy.
Ownership History
Date
Name
Owned For
Owner Type
Purchase Details
Closed on
May 25, 2011
Sold by
Debruyne Nancy Cozart and De Bruyne Charles Bartel
Bought by
Neill David J and Neill Jamie R W
Current Estimated Value
Home Financials for this Owner
Home Financials are based on the most recent Mortgage that was taken out on this home.
Original Mortgage
$236,000
Outstanding Balance
$162,719
Interest Rate
4.71%
Mortgage Type
New Conventional
Estimated Equity
$462,483
Purchase Details
Closed on
Oct 28, 2002
Sold by
Kelly Construction Co Of Durham Inc
Bought by
Debruyne Charles Bartel and Debruyne Nancy Cozart
Home Financials for this Owner
Home Financials are based on the most recent Mortgage that was taken out on this home.
Original Mortgage
$202,350
Interest Rate
4.12%
Create a Home Valuation Report for This Property
The Home Valuation Report is an in-depth analysis detailing your home's value as well as a comparison with similar homes in the area
Home Values in the Area
Average Home Value in this Area
Purchase History
| Date | Buyer | Sale Price | Title Company |
|---|---|---|---|
| Neill David J | $295,000 | None Available | |
| Debruyne Charles Bartel | $253,000 | -- |
Source: Public Records
Mortgage History
| Date | Status | Borrower | Loan Amount |
|---|---|---|---|
| Open | Neill David J | $236,000 | |
| Previous Owner | Debruyne Charles Bartel | $202,350 |
Source: Public Records
Tax History
| Year | Tax Paid | Tax Assessment Tax Assessment Total Assessment is a certain percentage of the fair market value that is determined by local assessors to be the total taxable value of land and additions on the property. | Land | Improvement |
|---|---|---|---|---|
| 2025 | $5,627 | $567,680 | $172,125 | $395,555 |
| 2024 | $4,560 | $326,934 | $71,771 | $255,163 |
| 2023 | $4,283 | $326,934 | $71,771 | $255,163 |
| 2022 | $4,184 | $326,934 | $71,771 | $255,163 |
| 2021 | $4,165 | $326,934 | $71,771 | $255,163 |
| 2020 | $4,067 | $326,934 | $71,771 | $255,163 |
| 2019 | $4,067 | $371,273 | $84,437 | $286,836 |
| 2018 | $4,326 | $318,918 | $47,285 | $271,633 |
| 2017 | $4,294 | $318,918 | $47,285 | $271,633 |
| 2016 | $4,149 | $323,963 | $47,285 | $276,678 |
| 2015 | $4,125 | $297,970 | $48,400 | $249,570 |
| 2014 | $4,125 | $297,970 | $48,400 | $249,570 |
Source: Public Records
Map
Nearby Homes
- 7602 Morrell Ln
- 8214 Eagle View Dr
- 1136 Southpoint Trail
- 1104 Scholastic Cir
- 1009 Chancellors Ridge Dr
- 7 Bobcat Ct
- 208 Education Ave
- 115 Chancellors Ridge Dr
- 102 College Ave
- 1026 Bradburn Dr
- 5111 Tudor Place
- 508 Colvard Woods Way
- 600 Audubon Lake Dr Unit 2c21
- 600 Audubon Lake Dr Unit 6b22
- 600 Audubon Lake Dr Unit 4c31
- 549 Darby Glen Ln Unit 549
- 1221 Bradburn Dr
- 204 S Bend Dr
- 341 Oxfordshire Ln
- 202 S Bend Dr
- 8403 Buck Crossing Dr
- 8311 Buck Crossing Dr
- 2 Mill Haven Ct
- 1 Mill Haven Ct
- LOT 34 Buck Crossing Dr
- 8309 Buck Crossing Dr
- 8407 Buck Crossing Dr
- 4 Mill Haven Ct
- 209 Norcross Rd
- 8310 Buck Crossing Dr
- 3 Mill Haven Ct
- 8111 Mackenzie Ct
- 5 Mill Haven Ct
- 8109 Mackenzie Ct
- 6 Mill Haven Ct
- 8415 Buck Crossing Dr
- 215 Norcross Rd
- 8107 Mackenzie Ct
- 7 Mill Haven Ct
- 9 Mill Haven Ct
Your Personal Tour Guide
Ask me questions while you tour the home.