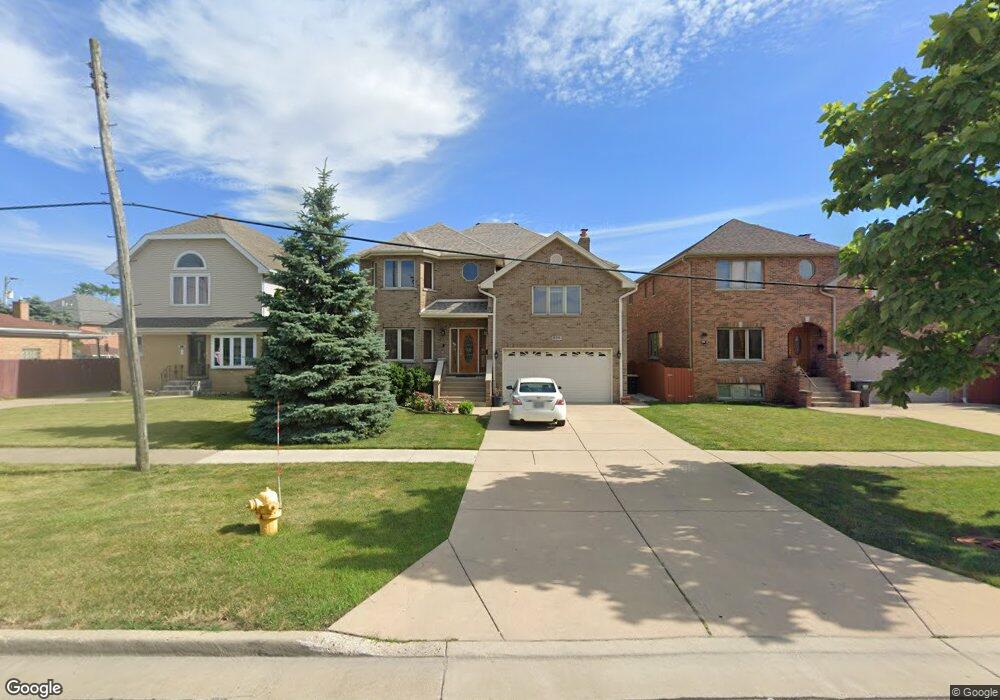
8315 W Ballard Rd Niles, IL 60714
Ballard Terrace NeighborhoodEstimated Value: $697,000 - $926,000
4
Beds
4
Baths
3,084
Sq Ft
$253/Sq Ft
Est. Value
About This Home
This home is located at 8315 W Ballard Rd, Niles, IL 60714 and is currently estimated at $778,738, approximately $252 per square foot. 8315 W Ballard Rd is a home located in Cook County with nearby schools including V H Nelson Elementary School, Gemini Middle School, and Maine East High School.
Ownership History
Date
Name
Owned For
Owner Type
Purchase Details
Closed on
Jul 7, 2010
Sold by
Akellian Jacob and Akellian Sonia
Bought by
The Jacob & Sonia Akellian Revocable Liv
Current Estimated Value
Purchase Details
Closed on
Dec 8, 2002
Sold by
Morgae Irene A
Bought by
Wojtowicz Roman and Wojtowicz Bozena
Home Financials for this Owner
Home Financials are based on the most recent Mortgage that was taken out on this home.
Original Mortgage
$504,000
Interest Rate
5.37%
Mortgage Type
Unknown
Purchase Details
Closed on
Dec 5, 2002
Sold by
Wojtowicz Roman and Wojtowicz Bozena
Bought by
Akellian Jacob and Akellian Sonia
Home Financials for this Owner
Home Financials are based on the most recent Mortgage that was taken out on this home.
Original Mortgage
$504,000
Interest Rate
5.37%
Mortgage Type
Unknown
Purchase Details
Closed on
Mar 22, 1999
Sold by
Morgan Ronald A and Morgan Irene A
Bought by
Morgan Irene A and Irene A Morgan Trust
Create a Home Valuation Report for This Property
The Home Valuation Report is an in-depth analysis detailing your home's value as well as a comparison with similar homes in the area
Home Values in the Area
Average Home Value in this Area
Purchase History
| Date | Buyer | Sale Price | Title Company |
|---|---|---|---|
| The Jacob & Sonia Akellian Revocable Liv | -- | None Available | |
| Wojtowicz Roman | $355,000 | Agtf Inc | |
| Akellian Jacob | $630,000 | Heritage Title Co | |
| Morgan Irene A | -- | -- |
Source: Public Records
Mortgage History
| Date | Status | Borrower | Loan Amount |
|---|---|---|---|
| Previous Owner | Akellian Jacob | $504,000 |
Source: Public Records
Tax History
| Year | Tax Paid | Tax Assessment Tax Assessment Total Assessment is a certain percentage of the fair market value that is determined by local assessors to be the total taxable value of land and additions on the property. | Land | Improvement |
|---|---|---|---|---|
| 2025 | $11,985 | $68,798 | $4,034 | $64,764 |
| 2024 | $11,985 | $52,485 | $3,388 | $49,097 |
| 2023 | $12,102 | $56,165 | $3,388 | $52,777 |
| 2022 | $12,102 | $56,165 | $3,388 | $52,777 |
| 2021 | $10,135 | $40,921 | $2,904 | $38,017 |
| 2020 | $9,697 | $40,921 | $2,904 | $38,017 |
| 2019 | $10,994 | $51,799 | $2,904 | $48,895 |
| 2018 | $11,232 | $48,297 | $2,500 | $45,797 |
| 2017 | $11,149 | $48,297 | $2,500 | $45,797 |
| 2016 | $12,282 | $54,126 | $2,500 | $51,626 |
| 2015 | $11,621 | $45,828 | $2,097 | $43,731 |
| 2014 | $11,226 | $45,828 | $2,097 | $43,731 |
| 2013 | $11,009 | $45,828 | $2,097 | $43,731 |
Source: Public Records
Map
Nearby Homes
- 8208 W Park Ave
- 8435 W Oak Ave
- 8425 W Carol St
- 8512 W Crain St
- 9248 N Maryland St
- 9270 N Courtland Dr
- 9214 N Washington St
- 8426 W Betty Terrace
- 8820 N Elmore St
- 9326 Greenwood Ave
- 8970 N Parkside Ave Unit C408
- 8901 N Western Ave Unit A206
- 8000 W Lyons St
- 8455 N Chester Ave
- 9319 Knight Ave
- 8446 N Clifton Ave
- 9330 Murray Ct
- 2000 Parkside Dr Unit FG
- 8653 N Merrill St
- 8619 W Park Ln
- 8315 W Ballard Rd
- 8317 W Ballard Rd
- 8317 W Ballard Rd
- 8311 W Ballard Rd
- 8310 W Park Ave
- 8312 W Park Ave
- 8312 W Park Ave
- 8308 W Park Ave
- 8307 W Ballard Rd
- 8316 W Park Ave
- 8306 W Park Ave
- 8319 Ballard Rd
- 8318 W Park Ave
- 8304 W Park Ave
- 8305 W Ballard Rd
- 8314 W Ballard Rd
- 8316 W Ballard Rd
- 8302 W Park Ave
- 8320 W Park Ave
- 9000 N Maryland St
Your Personal Tour Guide
Ask me questions while you tour the home.