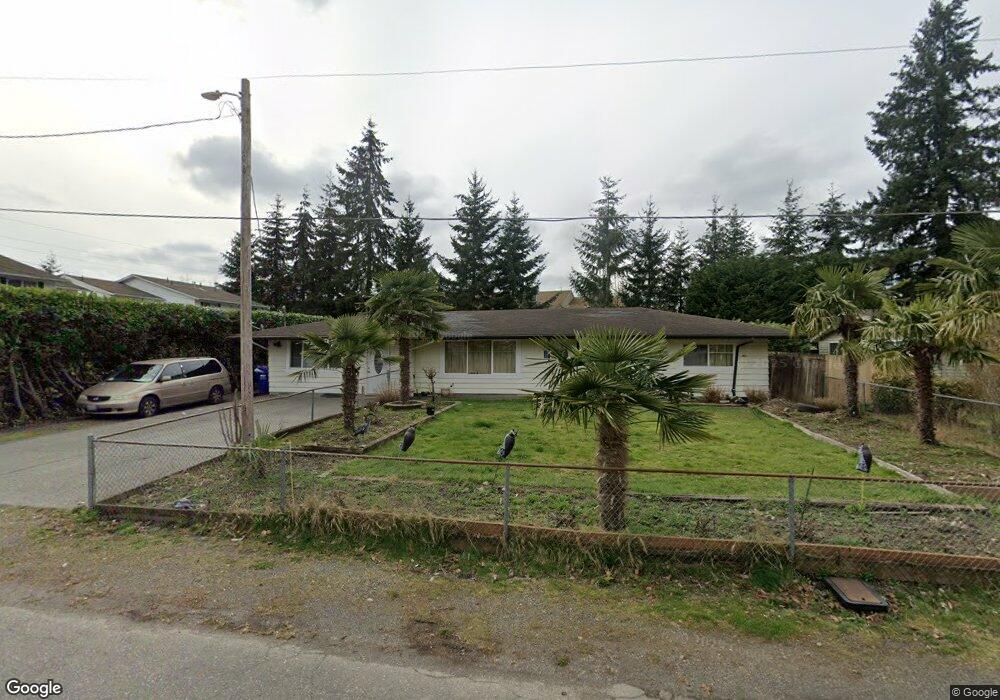
8316 Upper Ridge Rd Everett, WA 98203
Westmont NeighborhoodEstimated Value: $640,000 - $695,966
3
Beds
2
Baths
1,300
Sq Ft
$514/Sq Ft
Est. Value
About This Home
This home is located at 8316 Upper Ridge Rd, Everett, WA 98203 and is currently estimated at $667,742, approximately $513 per square foot. 8316 Upper Ridge Rd is a home located in Snohomish County with nearby schools including Horizon Elementary School, Olympic View Middle School, and Mariner High School.
Ownership History
Date
Name
Owned For
Owner Type
Purchase Details
Closed on
Dec 17, 2004
Sold by
Godfrey Wendy A and Godfrey Wendy R
Bought by
Delvillar Jose
Current Estimated Value
Home Financials for this Owner
Home Financials are based on the most recent Mortgage that was taken out on this home.
Original Mortgage
$46,590
Outstanding Balance
$23,348
Interest Rate
5.74%
Mortgage Type
Stand Alone Second
Estimated Equity
$644,394
Purchase Details
Closed on
Jun 26, 2002
Sold by
Godfrey John Michael
Bought by
Rawlings Wendy Ann and Godfrey Wendy R
Home Financials for this Owner
Home Financials are based on the most recent Mortgage that was taken out on this home.
Original Mortgage
$171,315
Interest Rate
6.78%
Purchase Details
Closed on
Sep 23, 1997
Sold by
Godfrey John Michael and Rawlings Wendy Ann
Bought by
Godfrey John Michael and Godfrey Wendy R
Home Financials for this Owner
Home Financials are based on the most recent Mortgage that was taken out on this home.
Original Mortgage
$117,000
Interest Rate
7.54%
Create a Home Valuation Report for This Property
The Home Valuation Report is an in-depth analysis detailing your home's value as well as a comparison with similar homes in the area
Home Values in the Area
Average Home Value in this Area
Purchase History
| Date | Buyer | Sale Price | Title Company |
|---|---|---|---|
| Delvillar Jose | $232,950 | Commonwealth Land Title | |
| Delvillar Jose | $11,235 | Commonwealth Land Title | |
| Rawlings Wendy Ann | -- | -- | |
| Godfrey John Michael | -- | Fidelity National Title |
Source: Public Records
Mortgage History
| Date | Status | Borrower | Loan Amount |
|---|---|---|---|
| Open | Delvillar Jose | $46,590 | |
| Open | Delvillar Jose | $186,360 | |
| Previous Owner | Rawlings Wendy Ann | $171,315 | |
| Previous Owner | Godfrey John Michael | $117,000 |
Source: Public Records
Tax History
| Year | Tax Paid | Tax Assessment Tax Assessment Total Assessment is a certain percentage of the fair market value that is determined by local assessors to be the total taxable value of land and additions on the property. | Land | Improvement |
|---|---|---|---|---|
| 2025 | $4,747 | $615,200 | $399,500 | $215,700 |
| 2024 | $4,747 | $598,000 | $382,300 | $215,700 |
| 2023 | $4,368 | $564,200 | $365,200 | $199,000 |
| 2022 | $3,907 | $436,800 | $258,600 | $178,200 |
| 2020 | $3,530 | $395,900 | $235,800 | $160,100 |
| 2019 | $2,722 | $308,400 | $158,000 | $150,400 |
| 2018 | $2,912 | $284,700 | $140,000 | $144,700 |
| 2017 | $2,719 | $271,100 | $140,000 | $131,100 |
| 2016 | $2,210 | $217,900 | $94,000 | $123,900 |
Source: Public Records
Map
Nearby Homes
- 126 W Casino Rd Unit 5
- 7910 E Glen Dr
- 8911 Holly Dr Unit 104
- 1001 W Casino Rd Unit C201
- 1001 W Casino Rd Unit A303
- 630 90th St SW Unit A/B
- 8823 Holly Dr Unit D203
- 8823 Holly Dr Unit C102
- 8823 Holly Dr Unit H206
- 8823 Holly Dr Unit H204
- 226 93rd Place SW Unit 8
- 501 75th Place SW
- 9 76th St SE
- 709 93rd St SW
- 7525 Beverly Ln
- 1430 W Casino Rd Unit 63
- 1430 W Casino Rd Unit 272
- 323 75th St SE Unit A14
- 323 75th St SE Unit B10
- 9521 Sharon Dr
- 8308 Upper Ridge Rd
- 8332 Upper Ridge Rd Unit C
- 8332 Upper Ridge Rd Unit D
- 8332 Upper Ridge Rd Unit B
- 8332 Upper Ridge Rd Unit A
- 8313 Upper Ridge Rd
- 8311 Upper Ridge Rd
- 8232 Upper Ridge Rd
- 211 W Casino Rd
- 8305 Upper Ridge Rd
- 8223 Upper Ridge Rd
- 8223 Upper Ridge Rd Unit D
- 311 W Casino Rd
- 205 W Casino Rd
- 8220 Upper Ridge Rd
- 8225 Upper Ridge Rd
- 125 W Casino Rd
- 310 W Casino Rd
- 310 W Casino Rd Unit 1
- 310 W Casino Rd Unit 4
Your Personal Tour Guide
Ask me questions while you tour the home.