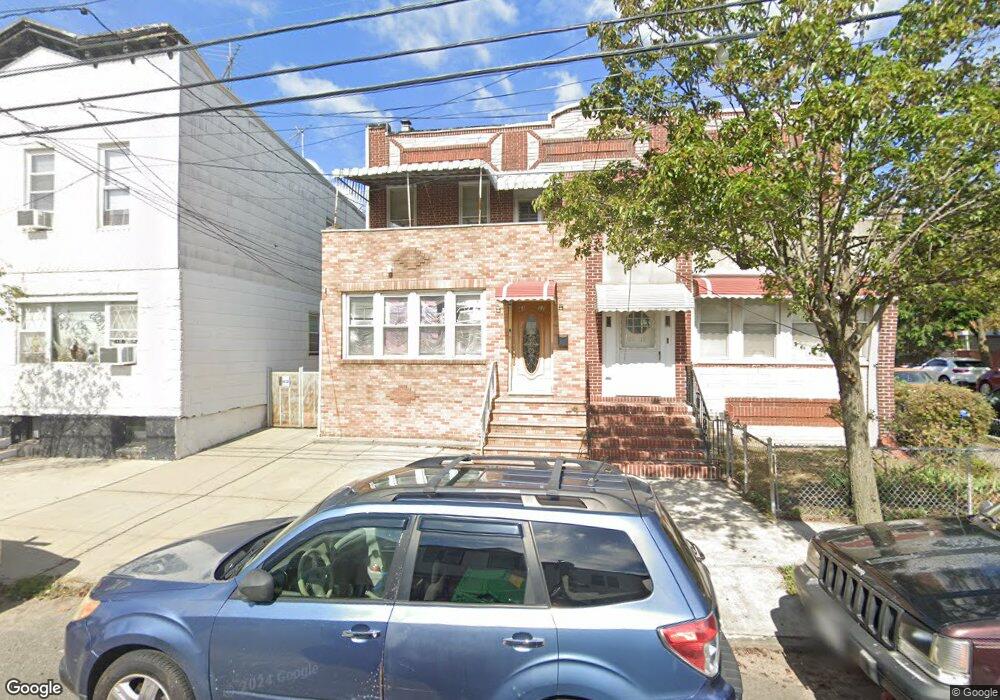
8317 95th Ave Ozone Park, NY 11416
Ozone Park NeighborhoodEstimated Value: $898,636 - $1,194,000
--
Bed
--
Bath
2,552
Sq Ft
$423/Sq Ft
Est. Value
About This Home
This home is located at 8317 95th Ave, Ozone Park, NY 11416 and is currently estimated at $1,080,659, approximately $423 per square foot. 8317 95th Ave is a home located in Queens County with nearby schools including P.S. 060 Woodhaven, Santiam Elementary School, and Alice Ott Middle School.
Ownership History
Date
Name
Owned For
Owner Type
Purchase Details
Closed on
Mar 19, 2002
Sold by
Billeri Vincenzo and Billeri Giuscia
Bought by
Avila Jose
Current Estimated Value
Home Financials for this Owner
Home Financials are based on the most recent Mortgage that was taken out on this home.
Original Mortgage
$304,000
Outstanding Balance
$126,899
Interest Rate
7.05%
Estimated Equity
$953,760
Purchase Details
Closed on
Dec 23, 1997
Sold by
Socci Maria C and Billeri Maria
Bought by
Billeri Vincenzo and Billeri Giuseppa
Create a Home Valuation Report for This Property
The Home Valuation Report is an in-depth analysis detailing your home's value as well as a comparison with similar homes in the area
Home Values in the Area
Average Home Value in this Area
Purchase History
| Date | Buyer | Sale Price | Title Company |
|---|---|---|---|
| Avila Jose | -- | -- | |
| Avila Jose | -- | -- | |
| Billeri Vincenzo | -- | Lawyers Title Insurance Corp | |
| Billeri Vincenzo | -- | Lawyers Title Insurance Corp |
Source: Public Records
Mortgage History
| Date | Status | Borrower | Loan Amount |
|---|---|---|---|
| Open | Avila Jose | $304,000 | |
| Closed | Avila Jose | $304,000 |
Source: Public Records
Tax History Compared to Growth
Tax History
| Year | Tax Paid | Tax Assessment Tax Assessment Total Assessment is a certain percentage of the fair market value that is determined by local assessors to be the total taxable value of land and additions on the property. | Land | Improvement |
|---|---|---|---|---|
| 2025 | $7,231 | $39,628 | $10,223 | $29,405 |
| 2024 | $7,243 | $37,404 | $9,290 | $28,114 |
| 2023 | $6,886 | $35,686 | $9,742 | $25,944 |
| 2022 | $6,494 | $61,140 | $16,020 | $45,120 |
| 2021 | $6,852 | $54,240 | $16,020 | $38,220 |
| 2020 | $6,694 | $53,340 | $16,020 | $37,320 |
| 2019 | $6,228 | $52,260 | $16,020 | $36,240 |
| 2018 | $5,764 | $29,738 | $11,359 | $18,379 |
| 2017 | $5,470 | $28,305 | $11,681 | $16,624 |
| 2016 | $5,349 | $28,305 | $11,681 | $16,624 |
| 2015 | $3,001 | $27,519 | $16,314 | $11,205 |
| 2014 | $3,001 | $25,975 | $17,694 | $8,281 |
Source: Public Records
Map
Nearby Homes