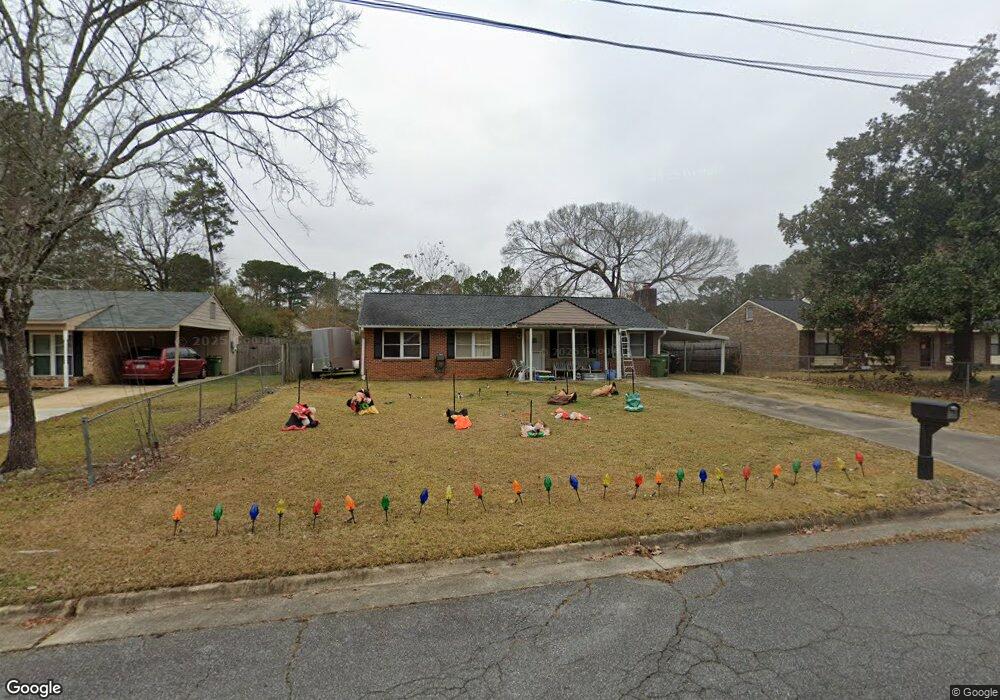
8317 Canaan Dr Columbus, GA 31904
North Columbus NeighborhoodEstimated Value: $175,000 - $209,000
3
Beds
2
Baths
1,350
Sq Ft
$141/Sq Ft
Est. Value
About This Home
This home is located at 8317 Canaan Dr, Columbus, GA 31904 and is currently estimated at $190,257, approximately $140 per square foot. 8317 Canaan Dr is a home located in Muscogee County with nearby schools including Double Churches Elementary School, Veterans Memorial Middle School, and Northside High School.
Ownership History
Date
Name
Owned For
Owner Type
Purchase Details
Closed on
May 22, 2015
Sold by
Austin Katherine K
Bought by
Watson Heather and Watson Matthew
Current Estimated Value
Home Financials for this Owner
Home Financials are based on the most recent Mortgage that was taken out on this home.
Original Mortgage
$106,043
Outstanding Balance
$83,346
Interest Rate
4.25%
Mortgage Type
FHA
Estimated Equity
$106,911
Purchase Details
Closed on
Aug 30, 2013
Sold by
Keystone Builders Inc
Bought by
Austin Katherine K
Purchase Details
Closed on
Apr 4, 2012
Sold by
Sec Of Housing & U
Bought by
Keystone Builders Inc
Home Financials for this Owner
Home Financials are based on the most recent Mortgage that was taken out on this home.
Original Mortgage
$51,227
Interest Rate
3.9%
Mortgage Type
New Conventional
Purchase Details
Closed on
Aug 19, 2011
Sold by
Citimortgage Inc
Bought by
Sec Dept Of Housing
Purchase Details
Closed on
Aug 2, 2011
Sold by
Citimortgage Inc
Bought by
Citimortgage Inc
Create a Home Valuation Report for This Property
The Home Valuation Report is an in-depth analysis detailing your home's value as well as a comparison with similar homes in the area
Home Values in the Area
Average Home Value in this Area
Purchase History
| Date | Buyer | Sale Price | Title Company |
|---|---|---|---|
| Watson Heather | $108,000 | -- | |
| Austin Katherine K | $92,000 | -- | |
| Keystone Builders Inc | $61,352 | -- | |
| Sec Dept Of Housing | $68,272 | -- | |
| Citimortgage Inc | $68,272 | -- |
Source: Public Records
Mortgage History
| Date | Status | Borrower | Loan Amount |
|---|---|---|---|
| Open | Watson Heather | $106,043 | |
| Previous Owner | Keystone Builders Inc | $51,227 |
Source: Public Records
Tax History
| Year | Tax Paid | Tax Assessment Tax Assessment Total Assessment is a certain percentage of the fair market value that is determined by local assessors to be the total taxable value of land and additions on the property. | Land | Improvement |
|---|---|---|---|---|
| 2025 | $2,003 | $51,164 | $8,244 | $42,920 |
| 2024 | $2,003 | $51,164 | $8,244 | $42,920 |
| 2023 | $2,015 | $51,164 | $8,244 | $42,920 |
| 2022 | $1,754 | $42,964 | $8,244 | $34,720 |
| 2021 | $1,705 | $41,752 | $8,244 | $33,508 |
| 2020 | $1,705 | $41,752 | $8,244 | $33,508 |
| 2019 | $1,711 | $41,752 | $8,244 | $33,508 |
| 2018 | $1,711 | $41,752 | $8,244 | $33,508 |
| 2017 | $1,716 | $41,752 | $8,244 | $33,508 |
| 2016 | $1,518 | $36,800 | $4,032 | $32,768 |
| 2015 | $972 | $36,800 | $4,032 | $32,768 |
| 2014 | -- | $36,800 | $4,032 | $32,768 |
| 2013 | -- | $36,919 | $4,032 | $32,887 |
Source: Public Records
Map
Nearby Homes
- 8334 Canaan Dr
- 8344 Twin Chapel Dr
- 1206 Rock Bridge Dr
- 994 Timber Creek Way
- 6742 Bridge Way
- 7841 Edgewater Dr
- 6712 Bridge Way
- 7730 Edgewater Dr
- 7724 Gray Shoals Dr
- 1442 Grove Park Dr Unit 2
- 1442 Grove Park Dr Unit 8
- 1727 Fountain Ct
- 8026 Splendor Way
- 907 Double Churches Rd
- 517 Double Churches Rd
- 1438 Grove Park Dr Unit 13B
- 1438 Grove Park Dr Unit 11B
- 281 Zachary Ct
- 717 Double Churches Rd
- 8935 A N Moore Rd
Your Personal Tour Guide
Ask me questions while you tour the home.