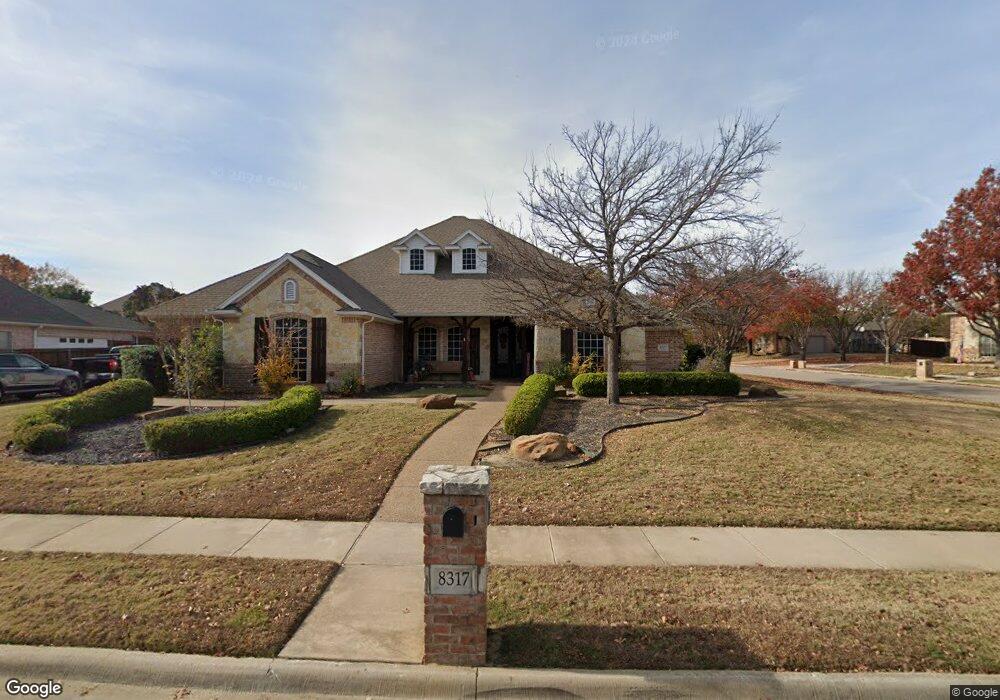
8317 Thornway Ct North Richland Hills, TX 76182
Estimated Value: $719,000 - $852,000
4
Beds
4
Baths
2,989
Sq Ft
$262/Sq Ft
Est. Value
About This Home
This home is located at 8317 Thornway Ct, North Richland Hills, TX 76182 and is currently estimated at $783,249, approximately $262 per square foot. 8317 Thornway Ct is a home located in Tarrant County with nearby schools including Liberty Elementary School, Bear Creek Intermediate School, and Keller Middle School.
Ownership History
Date
Name
Owned For
Owner Type
Purchase Details
Closed on
Nov 4, 2016
Sold by
Eberhart Patrick M and Eberhart Kimberly A
Bought by
Curnow Charles J and Curnow Jennifer L
Current Estimated Value
Purchase Details
Closed on
Jun 16, 2011
Sold by
Tayer Leslie H and Tayer Lois C
Bought by
Eberhart Patrick M and Eberhart Kimberly A
Home Financials for this Owner
Home Financials are based on the most recent Mortgage that was taken out on this home.
Original Mortgage
$272,000
Interest Rate
4.66%
Mortgage Type
New Conventional
Purchase Details
Closed on
Nov 30, 2006
Sold by
Chappell Larry W and Chappell Judy B
Bought by
Tayer Leslie H and Tayer Lois C
Home Financials for this Owner
Home Financials are based on the most recent Mortgage that was taken out on this home.
Original Mortgage
$159,000
Interest Rate
6.37%
Mortgage Type
Purchase Money Mortgage
Purchase Details
Closed on
Oct 2, 2001
Sold by
Flaherty Leo H
Bought by
Jefferson Heritage Bank
Purchase Details
Closed on
Jun 7, 2000
Sold by
Mls Partners Ltd
Bought by
Flaherty Leo H and Custom Concept Homes
Create a Home Valuation Report for This Property
The Home Valuation Report is an in-depth analysis detailing your home's value as well as a comparison with similar homes in the area
Home Values in the Area
Average Home Value in this Area
Purchase History
| Date | Buyer | Sale Price | Title Company |
|---|---|---|---|
| Curnow Charles J | -- | Fatco | |
| Eberhart Patrick M | -- | None Available | |
| Tayer Leslie H | -- | American Title | |
| Jefferson Heritage Bank | $184,342 | -- | |
| Flaherty Leo H | -- | Fidelity National Title Agen |
Source: Public Records
Mortgage History
| Date | Status | Borrower | Loan Amount |
|---|---|---|---|
| Previous Owner | Eberhart Patrick M | $272,000 | |
| Previous Owner | Tayer Leslie H | $159,000 |
Source: Public Records
Tax History Compared to Growth
Tax History
| Year | Tax Paid | Tax Assessment Tax Assessment Total Assessment is a certain percentage of the fair market value that is determined by local assessors to be the total taxable value of land and additions on the property. | Land | Improvement |
|---|---|---|---|---|
| 2025 | $9,413 | $726,104 | $150,662 | $575,442 |
| 2024 | $9,413 | $726,104 | $150,662 | $575,442 |
| 2023 | $11,164 | $630,000 | $150,662 | $479,338 |
| 2022 | $11,719 | $566,000 | $150,662 | $415,338 |
| 2021 | $11,362 | $444,001 | $100,000 | $344,001 |
| 2020 | $11,406 | $444,001 | $100,000 | $344,001 |
| 2019 | $11,941 | $444,000 | $100,000 | $344,000 |
| 2018 | $10,680 | $425,000 | $100,000 | $325,000 |
| 2017 | $11,337 | $411,263 | $100,000 | $311,263 |
| 2016 | $10,525 | $386,162 | $100,000 | $286,162 |
| 2015 | $8,121 | $347,100 | $55,000 | $292,100 |
| 2014 | $8,121 | $347,100 | $55,000 | $292,100 |
Source: Public Records
Map
Nearby Homes
- 8312 Thornway Ct
- 8381 Davis Blvd Unit 208
- 8315 Thornridge Dr
- 8932 Thornberry Dr
- 8600 Foxwood Dr
- 8205 Edgemont Ct
- 8324 Flat Rock Ct
- 8200 Thornhill Dr
- 8316 Westwind Ln
- 8113 Biscayne Ct
- 7905 Hallmark Dr
- 7908 Hallmark Dr
- 8229 Forest Glenn
- 8304 Precinct Line Rd
- Sandhill Plan at The Grove
- Caprock Plan at The Grove
- Franklin Plan at The Grove
- Hamilton Plan at The Grove
- Lyndon Plan at The Grove
- 6112 Emmas Ct
- 8313 Thornway Ct
- 8904 Thornway Dr
- 8909 Thornway Dr
- 8320 Thornway Ct
- 8316 Thornway Ct
- 8913 Thornway Dr
- 8360 Thornhill Dr
- 8905 Thornway Dr
- 8309 Thornway Ct
- 8917 Thornway Dr
- 8901 Thornway Dr
- 8356 Thornhill Dr
- 8804 Thornway Dr
- 8317 Thornbrook Ct
- 8321 Thornbrook Ct
- 8921 Thornway Dr
- 8305 Thornway Ct
- 8308 Thornway Ct
- 8313 Thornbrook Ct
- 8805 Thornway Dr