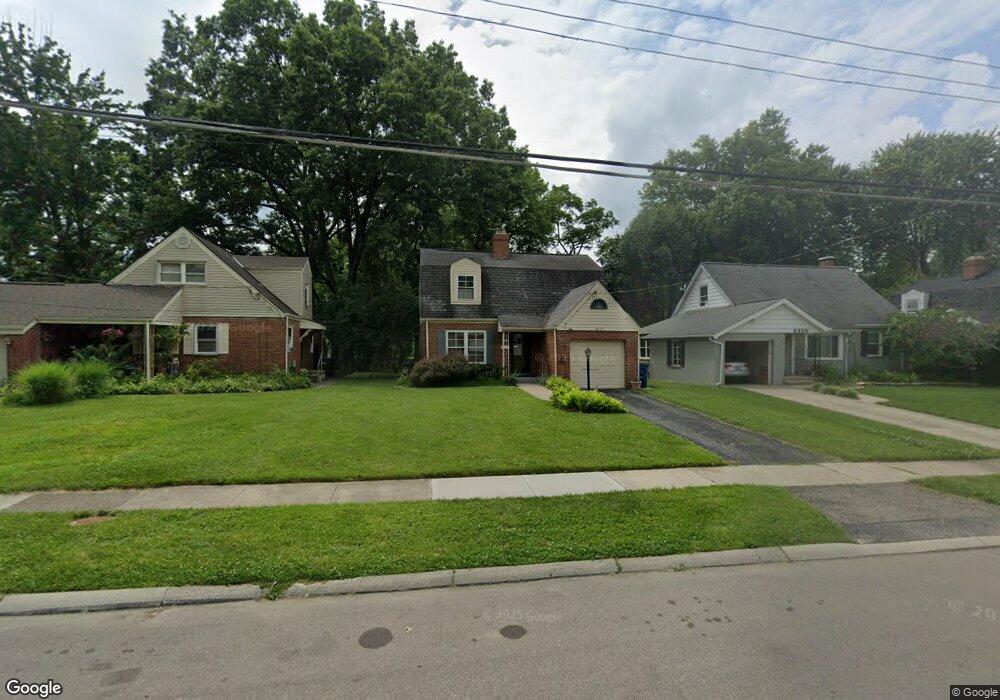
8317 Wicklow Ave Cincinnati, OH 45236
Estimated Value: $251,000 - $293,000
2
Beds
2
Baths
1,592
Sq Ft
$172/Sq Ft
Est. Value
About This Home
This home is located at 8317 Wicklow Ave, Cincinnati, OH 45236 and is currently estimated at $273,196, approximately $171 per square foot. 8317 Wicklow Ave is a home located in Hamilton County with nearby schools including Amity Elementary School, Deer Park Jr/Sr High School, and Ohr Torah Cincinnati.
Ownership History
Date
Name
Owned For
Owner Type
Purchase Details
Closed on
Nov 26, 2003
Sold by
Cain Amy L and Cain Scott B
Bought by
Deering Sylvia S
Current Estimated Value
Home Financials for this Owner
Home Financials are based on the most recent Mortgage that was taken out on this home.
Original Mortgage
$124,000
Outstanding Balance
$54,604
Interest Rate
5.62%
Mortgage Type
Unknown
Estimated Equity
$218,592
Purchase Details
Closed on
Oct 22, 2002
Sold by
Michael Sutter and Michael Debra M
Bought by
Burdsall Amy L
Home Financials for this Owner
Home Financials are based on the most recent Mortgage that was taken out on this home.
Original Mortgage
$87,500
Interest Rate
6.18%
Purchase Details
Closed on
Feb 27, 1998
Sold by
Rieder Terrence P and Rieder Kathleen A
Bought by
Sutter Michael
Home Financials for this Owner
Home Financials are based on the most recent Mortgage that was taken out on this home.
Original Mortgage
$88,400
Interest Rate
7.08%
Create a Home Valuation Report for This Property
The Home Valuation Report is an in-depth analysis detailing your home's value as well as a comparison with similar homes in the area
Home Values in the Area
Average Home Value in this Area
Purchase History
| Date | Buyer | Sale Price | Title Company |
|---|---|---|---|
| Deering Sylvia S | $124,000 | Title Quest Agency Inc | |
| Burdsall Amy L | $125,000 | Tri-Star Title Agency Inc | |
| Sutter Michael | $98,300 | -- |
Source: Public Records
Mortgage History
| Date | Status | Borrower | Loan Amount |
|---|---|---|---|
| Open | Deering Sylvia S | $124,000 | |
| Previous Owner | Burdsall Amy L | $87,500 | |
| Previous Owner | Sutter Michael | $88,400 |
Source: Public Records
Tax History
| Year | Tax Paid | Tax Assessment Tax Assessment Total Assessment is a certain percentage of the fair market value that is determined by local assessors to be the total taxable value of land and additions on the property. | Land | Improvement |
|---|---|---|---|---|
| 2025 | $3,660 | $69,017 | $10,959 | $58,058 |
| 2024 | $3,185 | $69,017 | $10,959 | $58,058 |
| 2023 | $3,290 | $69,017 | $10,959 | $58,058 |
| 2022 | $3,098 | $52,151 | $9,573 | $42,578 |
| 2021 | $3,021 | $52,151 | $9,573 | $42,578 |
| 2020 | $2,767 | $52,151 | $9,573 | $42,578 |
| 2019 | $3,245 | $45,746 | $8,397 | $37,349 |
| 2018 | $3,235 | $45,746 | $8,397 | $37,349 |
| 2017 | $3,061 | $45,746 | $8,397 | $37,349 |
| 2016 | $2,851 | $42,022 | $8,663 | $33,359 |
| 2015 | $2,645 | $42,022 | $8,663 | $33,359 |
| 2014 | $2,647 | $42,022 | $8,663 | $33,359 |
| 2013 | $2,732 | $42,879 | $8,838 | $34,041 |
Source: Public Records
Map
Nearby Homes
- 8390 Wexford Ave
- 8494 Wexford Ave
- 3647 Guam Ct
- 7837 Moss Ct
- 7905 Plainfield Rd
- 4104 Estermarie Dr
- 7719 Dearborn Ave
- 4120 Hoffman Ave
- 8608 Dundalk Ct
- 4123 Hoffman Ave
- 8468 Plainfield Rd
- 4208 Linden Ave
- 4009 Saint Johns Terrace
- 4050 O'Leary Ave
- 7651 Sagamore Dr
- 3982 Superior Ave
- 8622 Plainfield Ln
- 4053 Belfast Ave
- 4305 Myrtle Ave
- 4304 Kugler Mill Rd
- 8309 Wicklow Ave
- 8325 Wicklow Ave
- 8301 Wicklow Ave
- 8333 Wicklow Ave
- 8295 Wicklow Ave
- 8341 Wicklow Ave
- 3773 Jeffrey Ct
- 8349 Wicklow Ave
- 3765 Jeffrey Ct
- 8289 Wicklow Ave
- 8324 Wicklow Ave
- 8308 Wicklow Ave
- 8332 Wicklow Ave
- 8300 Wicklow Ave
- 3764 Langhorst Ct
- 3774 Langhorst Ct
- 8340 Wicklow Ave
- 8357 Wicklow Ave
- 8294 Wicklow Ave
- 8283 Wicklow Ave
Your Personal Tour Guide
Ask me questions while you tour the home.