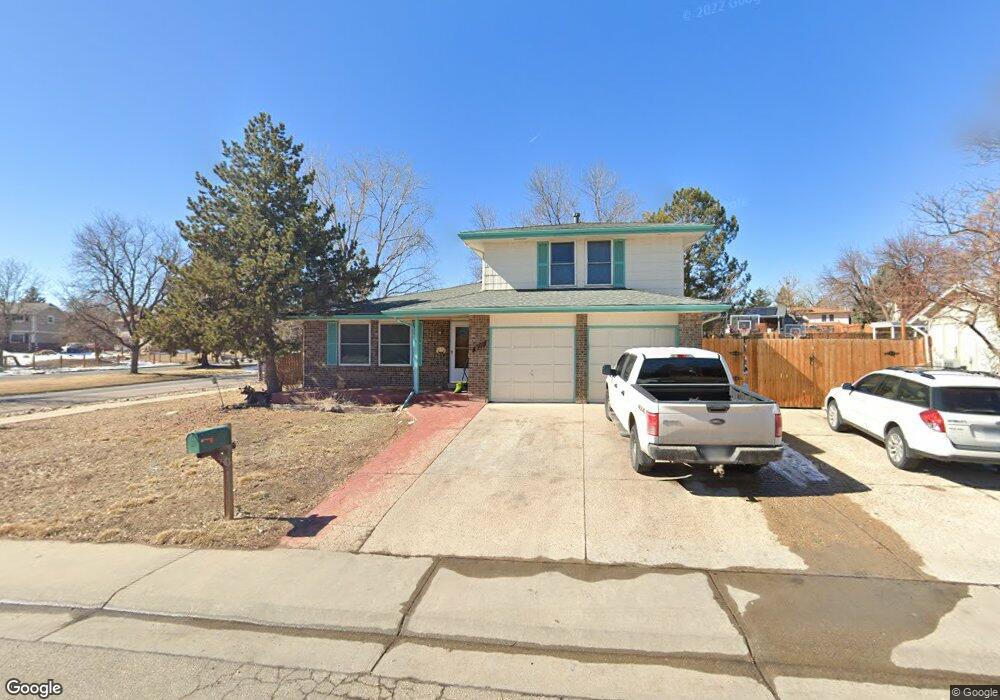
8317 Yarrow Ct Arvada, CO 80005
Meadowglen NeighborhoodEstimated Value: $602,000 - $645,411
3
Beds
5
Baths
2,164
Sq Ft
$288/Sq Ft
Est. Value
About This Home
This home is located at 8317 Yarrow Ct, Arvada, CO 80005 and is currently estimated at $622,853, approximately $287 per square foot. 8317 Yarrow Ct is a home located in Jefferson County with nearby schools including Weber Elementary School, Pomona High School, and Woodrow Wilson Academy.
Ownership History
Date
Name
Owned For
Owner Type
Purchase Details
Closed on
Jan 5, 2017
Sold by
Lindsay Tara
Bought by
Tanner John Paul and Lindsay Tara
Current Estimated Value
Home Financials for this Owner
Home Financials are based on the most recent Mortgage that was taken out on this home.
Original Mortgage
$254,000
Interest Rate
4.32%
Mortgage Type
New Conventional
Purchase Details
Closed on
Sep 1, 2009
Sold by
Lindsay Patrick J and Lindsay Patricia M
Bought by
Lindsay Tara
Home Financials for this Owner
Home Financials are based on the most recent Mortgage that was taken out on this home.
Original Mortgage
$200,000
Interest Rate
4.37%
Mortgage Type
New Conventional
Create a Home Valuation Report for This Property
The Home Valuation Report is an in-depth analysis detailing your home's value as well as a comparison with similar homes in the area
Home Values in the Area
Average Home Value in this Area
Purchase History
| Date | Buyer | Sale Price | Title Company |
|---|---|---|---|
| Tanner John Paul | -- | None Available | |
| Lindsay Tara | -- | None Available |
Source: Public Records
Mortgage History
| Date | Status | Borrower | Loan Amount |
|---|---|---|---|
| Closed | Tanner John Paul | $254,000 | |
| Closed | Lindsay Tara | $200,000 |
Source: Public Records
Tax History
| Year | Tax Paid | Tax Assessment Tax Assessment Total Assessment is a certain percentage of the fair market value that is determined by local assessors to be the total taxable value of land and additions on the property. | Land | Improvement |
|---|---|---|---|---|
| 2024 | $3,871 | $39,906 | $14,967 | $24,939 |
| 2023 | $3,871 | $39,906 | $14,967 | $24,939 |
| 2022 | $3,026 | $30,903 | $9,675 | $21,228 |
| 2021 | $3,076 | $31,792 | $9,954 | $21,838 |
| 2020 | $2,718 | $28,165 | $9,081 | $19,084 |
| 2019 | $2,681 | $28,165 | $9,081 | $19,084 |
| 2018 | $2,498 | $25,511 | $7,598 | $17,913 |
| 2017 | $2,287 | $25,511 | $7,598 | $17,913 |
| 2016 | $2,241 | $23,549 | $6,507 | $17,042 |
| 2015 | $1,960 | $23,549 | $6,507 | $17,042 |
| 2014 | $1,960 | $19,354 | $6,459 | $12,895 |
Source: Public Records
Map
Nearby Homes
- 8257 Yarrow Ct
- 7584 W 83rd Ave
- 7862 W 84th Ct
- 8685 Yukon St Unit 5
- 7870 W 87th Dr Unit J
- 8695 Yukon St Unit O
- 7790 W 87th Dr Unit D
- 7780 W 87th Dr Unit E
- 8164 Carr Cir
- 7770 W 87th Dr Unit D
- 7720 W 87th Dr Unit C
- 8144 Carr Cir
- 7730 W 87th Dr Unit I
- 7237 W 83rd Way
- 14551 W 91st Ln Unit A
- 8465 Dover Way
- 8733 Yukon St
- 8336 W 87th Dr Unit D
- 8346 W 87th Dr Unit D
- 6816 W 84th Cir Unit 38
Your Personal Tour Guide
Ask me questions while you tour the home.