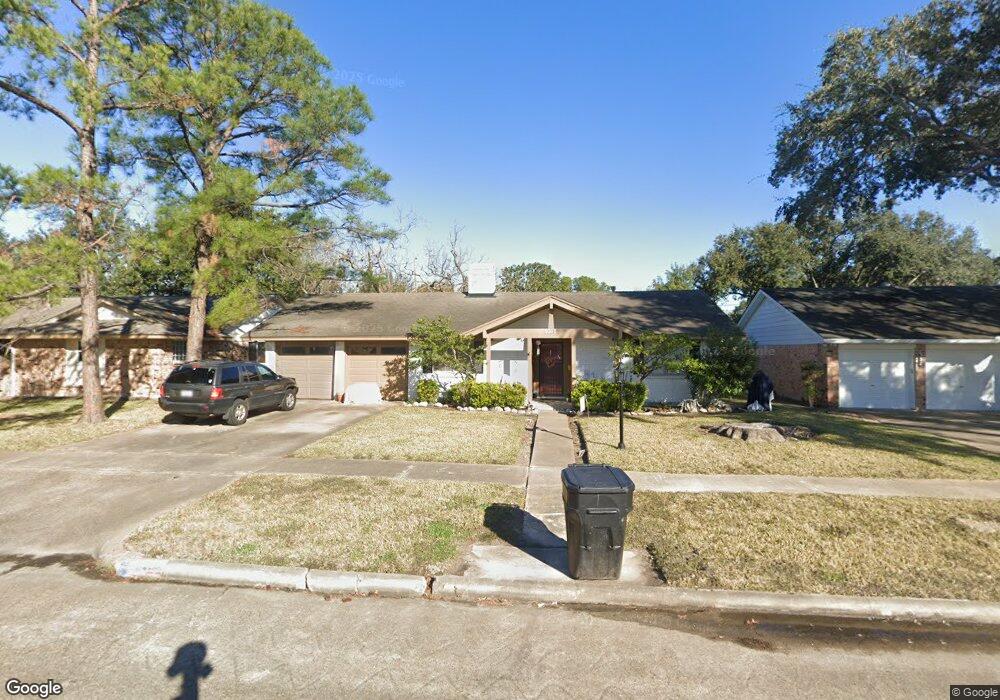
8318 Hazen St Houston, TX 77036
Sharpstown NeighborhoodEstimated Value: $276,077 - $301,000
3
Beds
2
Baths
1,614
Sq Ft
$178/Sq Ft
Est. Value
About This Home
This home is located at 8318 Hazen St, Houston, TX 77036 and is currently estimated at $286,519, approximately $177 per square foot. 8318 Hazen St is a home located in Harris County with nearby schools including Neff Elementary School, Sugar Grove Academy, and Sharpstown High School.
Ownership History
Date
Name
Owned For
Owner Type
Purchase Details
Closed on
Nov 5, 2007
Sold by
Ferretti Ted M and Ferretti Jaymie L
Bought by
Solis Daniel
Current Estimated Value
Home Financials for this Owner
Home Financials are based on the most recent Mortgage that was taken out on this home.
Original Mortgage
$127,070
Outstanding Balance
$80,357
Interest Rate
6.37%
Mortgage Type
Purchase Money Mortgage
Estimated Equity
$206,162
Purchase Details
Closed on
Mar 14, 2003
Sold by
Ruth M Lett Trust and Lett Ruth M
Bought by
Ferretti Ted M and Ferretti Jaymie L
Home Financials for this Owner
Home Financials are based on the most recent Mortgage that was taken out on this home.
Original Mortgage
$118,736
Interest Rate
5.83%
Mortgage Type
FHA
Purchase Details
Closed on
Jan 19, 1998
Sold by
Guntz Mary Sue Robinson and Newman Jenny Lou Robinson
Bought by
Lett Ruth M and Lett Katherine Louise
Create a Home Valuation Report for This Property
The Home Valuation Report is an in-depth analysis detailing your home's value as well as a comparison with similar homes in the area
Home Values in the Area
Average Home Value in this Area
Purchase History
| Date | Buyer | Sale Price | Title Company |
|---|---|---|---|
| Solis Daniel | -- | Houston Title Co | |
| Ferretti Ted M | -- | Chicago Title | |
| Lett Ruth M | -- | Alamo Title Company #77 |
Source: Public Records
Mortgage History
| Date | Status | Borrower | Loan Amount |
|---|---|---|---|
| Open | Solis Daniel | $127,070 | |
| Previous Owner | Ferretti Ted M | $118,736 |
Source: Public Records
Tax History Compared to Growth
Tax History
| Year | Tax Paid | Tax Assessment Tax Assessment Total Assessment is a certain percentage of the fair market value that is determined by local assessors to be the total taxable value of land and additions on the property. | Land | Improvement |
|---|---|---|---|---|
| 2025 | $3,377 | $272,926 | $135,032 | $137,894 |
| 2024 | $3,377 | $256,809 | $97,523 | $159,286 |
| 2023 | $3,377 | $260,054 | $97,523 | $162,531 |
| 2022 | $4,774 | $233,038 | $60,014 | $173,024 |
| 2021 | $4,433 | $190,208 | $60,014 | $130,194 |
| 2020 | $4,925 | $196,871 | $60,014 | $136,857 |
| 2019 | $5,017 | $192,200 | $45,011 | $147,189 |
| 2018 | $3,432 | $187,158 | $45,011 | $142,147 |
| 2017 | $4,352 | $182,608 | $45,011 | $137,597 |
| 2016 | $3,956 | $175,382 | $45,011 | $130,371 |
| 2015 | $2,411 | $157,180 | $45,011 | $112,169 |
| 2014 | $2,411 | $137,174 | $45,011 | $92,163 |
Source: Public Records
Map
Nearby Homes
- 8218 Hazen St
- 8119 Concho St
- 8418 Hazen St
- 8019 Sharpview Dr
- 7302 Burning Tree Dr
- 7302 Redding Rd
- 8530 Roos Rd
- 7303 Augustine Dr
- 8222 La Roche Ln
- 8826 Tanager St
- 8923 Hendon Ln
- 7622 Troulon Dr
- 8818 Roos Rd
- 8314 Edgemoor Dr
- 8515 Edgemoor Dr
- 9010 Imogene St Unit A
- 8918 Grape St
- 8979 Imogene St
- 8826 Rowan Ln
- 8714 Wateka Dr