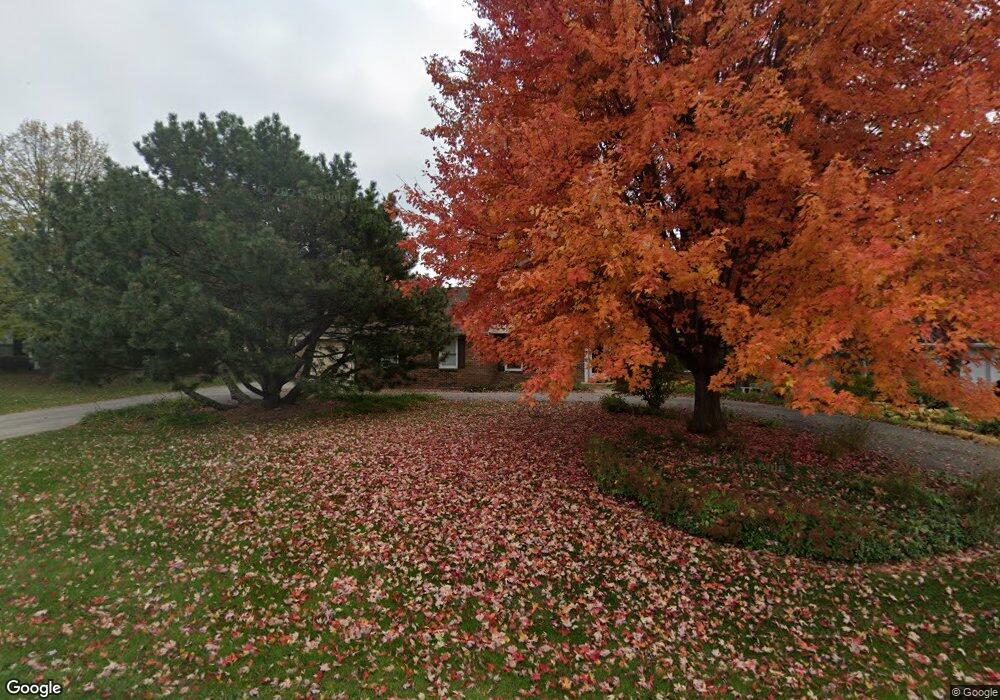
8319 Cambridge Ct Downers Grove, IL 60516
Estimated Value: $723,000 - $948,000
4
Beds
3
Baths
2,832
Sq Ft
$278/Sq Ft
Est. Value
About This Home
This home is located at 8319 Cambridge Ct, Downers Grove, IL 60516 and is currently estimated at $787,877, approximately $278 per square foot. 8319 Cambridge Ct is a home located in DuPage County with nearby schools including Prairieview Elementary School, Elizabeth Ide Elementary School, and Lakeview Jr High School.
Ownership History
Date
Name
Owned For
Owner Type
Purchase Details
Closed on
Jun 8, 2007
Sold by
Stock Christopher A and Stock Judith V
Bought by
Kozlowski Douglas J and Kozlowski Karen L
Current Estimated Value
Home Financials for this Owner
Home Financials are based on the most recent Mortgage that was taken out on this home.
Original Mortgage
$417,000
Outstanding Balance
$255,298
Interest Rate
6.2%
Mortgage Type
Purchase Money Mortgage
Estimated Equity
$532,579
Purchase Details
Closed on
Jun 21, 2004
Sold by
Petrie Barbara G and Barbara G Petrie Trust
Bought by
Stock Christopher A and Stock Judith V
Home Financials for this Owner
Home Financials are based on the most recent Mortgage that was taken out on this home.
Original Mortgage
$333,700
Interest Rate
6.42%
Mortgage Type
Purchase Money Mortgage
Create a Home Valuation Report for This Property
The Home Valuation Report is an in-depth analysis detailing your home's value as well as a comparison with similar homes in the area
Home Values in the Area
Average Home Value in this Area
Purchase History
| Date | Buyer | Sale Price | Title Company |
|---|---|---|---|
| Kozlowski Douglas J | $650,000 | First American Title | |
| Stock Christopher A | $555,000 | Pntn |
Source: Public Records
Mortgage History
| Date | Status | Borrower | Loan Amount |
|---|---|---|---|
| Open | Kozlowski Douglas J | $417,000 | |
| Previous Owner | Stock Christopher A | $333,700 | |
| Closed | Stock Christopher A | $104,000 |
Source: Public Records
Tax History Compared to Growth
Tax History
| Year | Tax Paid | Tax Assessment Tax Assessment Total Assessment is a certain percentage of the fair market value that is determined by local assessors to be the total taxable value of land and additions on the property. | Land | Improvement |
|---|---|---|---|---|
| 2024 | $10,764 | $197,773 | $58,785 | $138,988 |
| 2023 | $10,330 | $181,810 | $54,040 | $127,770 |
| 2022 | $9,753 | $172,110 | $52,160 | $119,950 |
| 2021 | $8,909 | $170,160 | $51,570 | $118,590 |
| 2020 | $8,755 | $166,790 | $50,550 | $116,240 |
| 2019 | $8,462 | $160,030 | $48,500 | $111,530 |
| 2018 | $8,605 | $159,620 | $48,240 | $111,380 |
| 2017 | $8,278 | $153,600 | $46,420 | $107,180 |
| 2016 | $7,871 | $146,590 | $44,300 | $102,290 |
| 2015 | $7,762 | $137,920 | $41,680 | $96,240 |
| 2014 | $7,629 | $134,090 | $40,520 | $93,570 |
| 2013 | $7,752 | $133,460 | $40,330 | $93,130 |
Source: Public Records
Map
Nearby Homes
- 960 86th St
- 8620 Washington St
- 2611 Woodmere Dr Unit 24
- 8511 Kearney Rd
- 2667 Woodmere Dr Unit 44
- 7925 Fairmount Ave
- 8100 Woodglen Ln Unit 204
- 9S211 Graceland St
- 1133 Central Ave
- 2221 Donegal Dr
- 8000 Woodglen Ln Unit 101
- 8250 Lemont Rd
- 7930 Woodglen Ln Unit 204
- 2417 Green Valley Rd
- 8240 Lemont Rd
- 500 Redondo Dr Unit 409
- 500 Redondo Dr Unit 308
- 512 Redondo Dr Unit 512
- 512 Redondo Dr Unit 112
- 505 Redondo Dr Unit 308
- 8327 Lakeside Dr
- 8313 Cambridge Ct
- 8300 Cambridge Ct
- 728 Millbrook Dr
- 8309 Cambridge Ct
- 736 Millbrook Dr
- 8326 Cambridge Ct
- 720 Millbrook Dr
- 8317 Lakeside Dr
- 8328 Lakeside Dr
- 8248 Cambridge Ct
- 712 Millbrook Dr
- 8332 Lakeside Dr
- 8320 Lakeside Dr
- 8247 Cambridge Ct
- 8340 Lakeside Dr
- 704 Millbrook Dr
- 8240 Cambridge Ct
- 8309 Lakeside Dr
- 8316 Lakeside Dr