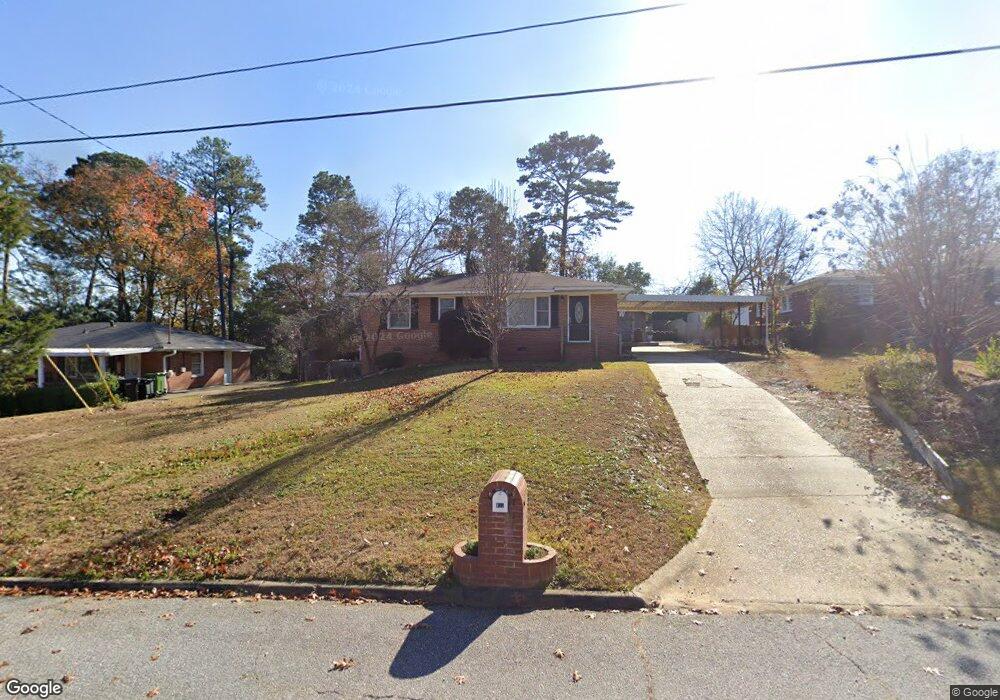
832 53rd St Columbus, GA 31904
Northern Columbus NeighborhoodEstimated Value: $189,000 - $209,000
3
Beds
3
Baths
1,508
Sq Ft
$131/Sq Ft
Est. Value
About This Home
This home is located at 832 53rd St, Columbus, GA 31904 and is currently estimated at $197,106, approximately $130 per square foot. 832 53rd St is a home located in Muscogee County with nearby schools including River Road Elementary School, Arnold Middle School, and Jordan Vocational High School.
Ownership History
Date
Name
Owned For
Owner Type
Purchase Details
Closed on
Oct 27, 2016
Sold by
Chelsea L
Bought by
Woodrum Christopher M
Current Estimated Value
Purchase Details
Closed on
Feb 26, 2016
Sold by
Courvelle Jessie C
Bought by
Woodrum Christopher M and Hughes Chelsea L
Home Financials for this Owner
Home Financials are based on the most recent Mortgage that was taken out on this home.
Original Mortgage
$125,681
Interest Rate
4.5%
Mortgage Type
FHA
Purchase Details
Closed on
Dec 28, 2012
Sold by
Courvelle Johnna Lenore
Bought by
Courvelle Jessie Chadwick
Create a Home Valuation Report for This Property
The Home Valuation Report is an in-depth analysis detailing your home's value as well as a comparison with similar homes in the area
Home Values in the Area
Average Home Value in this Area
Purchase History
| Date | Buyer | Sale Price | Title Company |
|---|---|---|---|
| Woodrum Christopher M | -- | -- | |
| Woodrum Christopher M | $128,000 | -- | |
| Courvelle Jessie Chadwick | -- | -- |
Source: Public Records
Mortgage History
| Date | Status | Borrower | Loan Amount |
|---|---|---|---|
| Previous Owner | Woodrum Christopher M | $125,681 |
Source: Public Records
Tax History Compared to Growth
Tax History
| Year | Tax Paid | Tax Assessment Tax Assessment Total Assessment is a certain percentage of the fair market value that is determined by local assessors to be the total taxable value of land and additions on the property. | Land | Improvement |
|---|---|---|---|---|
| 2025 | $1,488 | $69,172 | $11,932 | $57,240 |
| 2024 | $1,487 | $69,172 | $11,932 | $57,240 |
| 2023 | $802 | $69,172 | $11,932 | $57,240 |
| 2022 | $1,551 | $52,196 | $8,948 | $43,248 |
| 2021 | $1,544 | $55,288 | $8,948 | $46,340 |
| 2020 | $1,544 | $55,288 | $8,948 | $46,340 |
| 2019 | $1,551 | $55,288 | $8,948 | $46,340 |
| 2018 | $1,551 | $55,288 | $8,948 | $46,340 |
| 2017 | $1,558 | $51,200 | $8,680 | $42,520 |
| 2016 | $1,109 | $54,175 | $3,040 | $51,135 |
| 2015 | $1,111 | $54,175 | $3,040 | $51,135 |
| 2014 | $1,114 | $54,175 | $3,040 | $51,135 |
| 2013 | -- | $54,175 | $3,040 | $51,135 |
Source: Public Records
Map
Nearby Homes
- 831 53rd St
- 5357 Gibney Dr
- 5212 River Rd
- 5027 Abbott Ave
- 643 Lichfield Rd
- 5601 Morris Ave
- 217 Moss Dr
- 1103 52nd St
- 5118 11th Ave
- 5110 11th Ave
- 5106 11th Ave
- 411 49th St
- 5908 Brookstone Blvd
- 616 Newport Place
- 5608 Grove Ave
- 438 Newport Place
- 5534 Orchard Dr
- 521 Newport Place
- 4422 Oates Ave
- 6130 Bristol Blvd