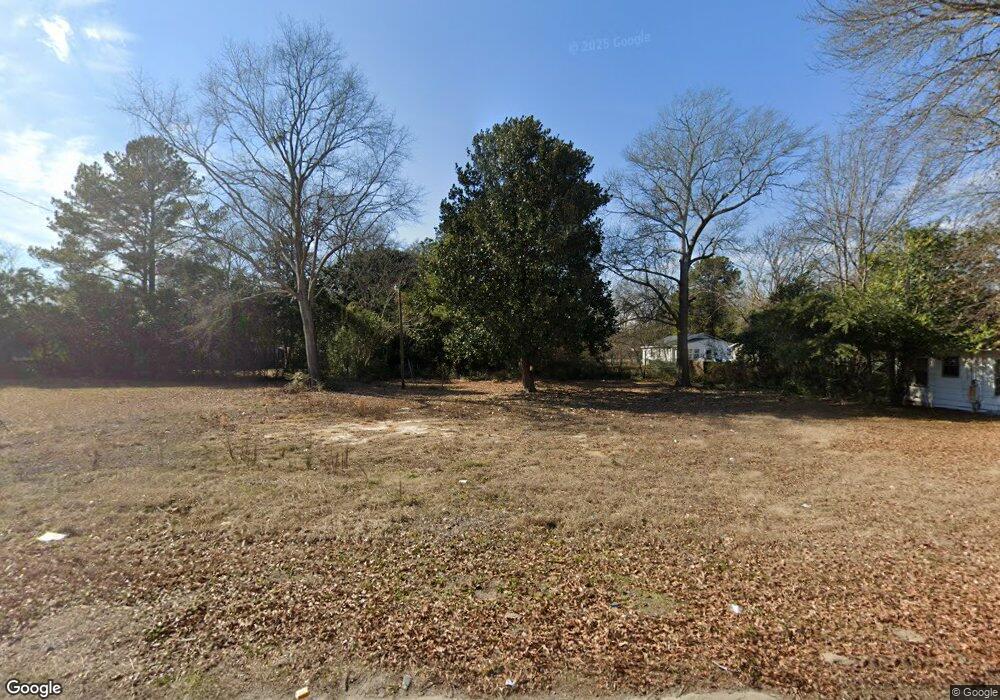
832 N Main St Sumter, SC 29150
Morris College NeighborhoodEstimated Value: $191,000
2
Beds
--
Bath
796
Sq Ft
$240/Sq Ft
Est. Value
About This Home
This home is located at 832 N Main St, Sumter, SC 29150 and is currently estimated at $191,000, approximately $239 per square foot. 832 N Main St is a home located in Sumter County with nearby schools including Crosswell Drive Elementary School, Chestnut Oaks Middle School, and Sumter High School.
Ownership History
Date
Name
Owned For
Owner Type
Purchase Details
Closed on
Jan 25, 2022
Sold by
Willie Wilson
Bought by
Baptist Education And Missionary Convention O
Current Estimated Value
Purchase Details
Closed on
Feb 1, 2010
Sold by
Nelson Kenneth Lee
Bought by
Wilson Willie and Wilson Itlean H
Home Financials for this Owner
Home Financials are based on the most recent Mortgage that was taken out on this home.
Original Mortgage
$25,000
Interest Rate
4.97%
Mortgage Type
Seller Take Back
Create a Home Valuation Report for This Property
The Home Valuation Report is an in-depth analysis detailing your home's value as well as a comparison with similar homes in the area
Home Values in the Area
Average Home Value in this Area
Purchase History
| Date | Buyer | Sale Price | Title Company |
|---|---|---|---|
| Baptist Education And Missionary Convention O | $48,000 | Law Office Of Larry C Weston | |
| Wilson Willie | $30,000 | -- |
Source: Public Records
Mortgage History
| Date | Status | Borrower | Loan Amount |
|---|---|---|---|
| Previous Owner | Wilson Willie | $25,000 |
Source: Public Records
Tax History
| Year | Tax Paid | Tax Assessment Tax Assessment Total Assessment is a certain percentage of the fair market value that is determined by local assessors to be the total taxable value of land and additions on the property. | Land | Improvement |
|---|---|---|---|---|
| 2025 | $720 | $900 | $900 | -- |
| 2024 | $720 | $900 | $900 | -- |
| 2023 | $720 | $1,780 | $900 | $880 |
| 2022 | $713 | $1,780 | $900 | $880 |
| 2021 | $723 | $1,780 | $900 | $880 |
| 2020 | $723 | $1,770 | $900 | $870 |
| 2019 | $719 | $1,770 | $900 | $870 |
| 2018 | $721 | $1,770 | $900 | $870 |
| 2017 | $725 | $1,770 | $900 | $870 |
| 2016 | $715 | $1,770 | $900 | $870 |
| 2015 | $642 | $1,610 | $540 | $1,070 |
| 2014 | $642 | $1,610 | $540 | $1,070 |
| 2013 | -- | $1,610 | $540 | $1,070 |
Source: Public Records
Map
Nearby Homes
Your Personal Tour Guide
Ask me questions while you tour the home.