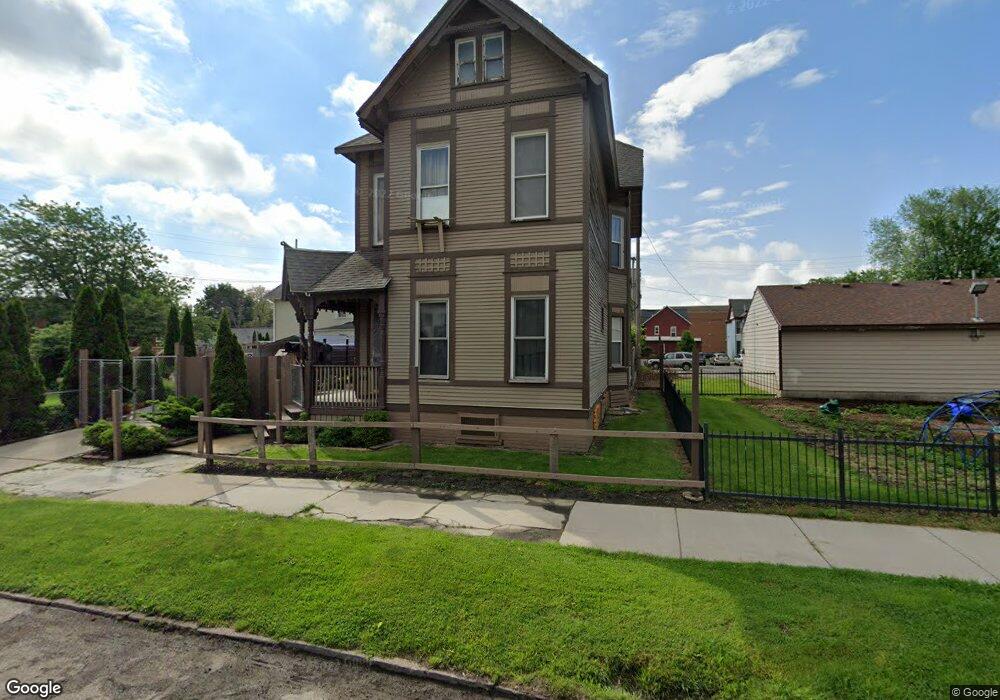
832 N Ontario St Toledo, OH 43604
Lagrange NeighborhoodEstimated Value: $72,000 - $85,000
4
Beds
2
Baths
2,096
Sq Ft
$39/Sq Ft
Est. Value
About This Home
This home is located at 832 N Ontario St, Toledo, OH 43604 and is currently estimated at $80,915, approximately $38 per square foot. 832 N Ontario St is a home located in Lucas County with nearby schools including Sherman Elementary School, Woodward High School, and The Maritime Academy of Toledo.
Ownership History
Date
Name
Owned For
Owner Type
Purchase Details
Closed on
Feb 9, 2011
Sold by
Abreu Annette and Abreu Junior R
Bought by
Gallegos Luz E
Current Estimated Value
Purchase Details
Closed on
Nov 8, 2005
Sold by
Jab Investments Inc
Bought by
Abreu Junior R and Abreu Annette
Purchase Details
Closed on
Oct 20, 2005
Sold by
Bay Financial Savings Bank Fsb
Bought by
Jab Investments Inc
Purchase Details
Closed on
May 15, 2005
Sold by
Erving Irene
Bought by
Bay Financial Savings Bank Fsb
Purchase Details
Closed on
Nov 14, 1995
Sold by
Northriver Dev Corp
Bought by
Erving Irene
Home Financials for this Owner
Home Financials are based on the most recent Mortgage that was taken out on this home.
Original Mortgage
$27,300
Interest Rate
7.7%
Mortgage Type
New Conventional
Purchase Details
Closed on
Jan 6, 1994
Sold by
Copeland Toshie
Create a Home Valuation Report for This Property
The Home Valuation Report is an in-depth analysis detailing your home's value as well as a comparison with similar homes in the area
Home Values in the Area
Average Home Value in this Area
Purchase History
| Date | Buyer | Sale Price | Title Company |
|---|---|---|---|
| Gallegos Luz E | $10,000 | None Available | |
| Abreu Junior R | $16,700 | Louisville Title Agency For | |
| Jab Investments Inc | $8,500 | -- | |
| Bay Financial Savings Bank Fsb | $26,667 | -- | |
| Erving Irene | $37,170 | -- | |
| -- | -- | -- |
Source: Public Records
Mortgage History
| Date | Status | Borrower | Loan Amount |
|---|---|---|---|
| Previous Owner | Erving Irene | $27,300 |
Source: Public Records
Tax History Compared to Growth
Tax History
| Year | Tax Paid | Tax Assessment Tax Assessment Total Assessment is a certain percentage of the fair market value that is determined by local assessors to be the total taxable value of land and additions on the property. | Land | Improvement |
|---|---|---|---|---|
| 2024 | $750 | $21,140 | $2,590 | $18,550 |
| 2023 | $1,116 | $14,000 | $2,450 | $11,550 |
| 2022 | $1,123 | $14,000 | $2,450 | $11,550 |
| 2021 | $1,134 | $14,000 | $2,450 | $11,550 |
| 2020 | $1,121 | $11,620 | $2,030 | $9,590 |
| 2019 | $1,073 | $11,620 | $2,030 | $9,590 |
| 2018 | $1,058 | $11,620 | $2,030 | $9,590 |
| 2017 | $986 | $9,835 | $1,715 | $8,120 |
| 2016 | $1,024 | $28,100 | $4,900 | $23,200 |
| 2015 | $1,024 | $28,100 | $4,900 | $23,200 |
| 2014 | $619 | $9,840 | $1,720 | $8,120 |
| 2013 | $619 | $9,840 | $1,720 | $8,120 |
Source: Public Records
Map
Nearby Homes