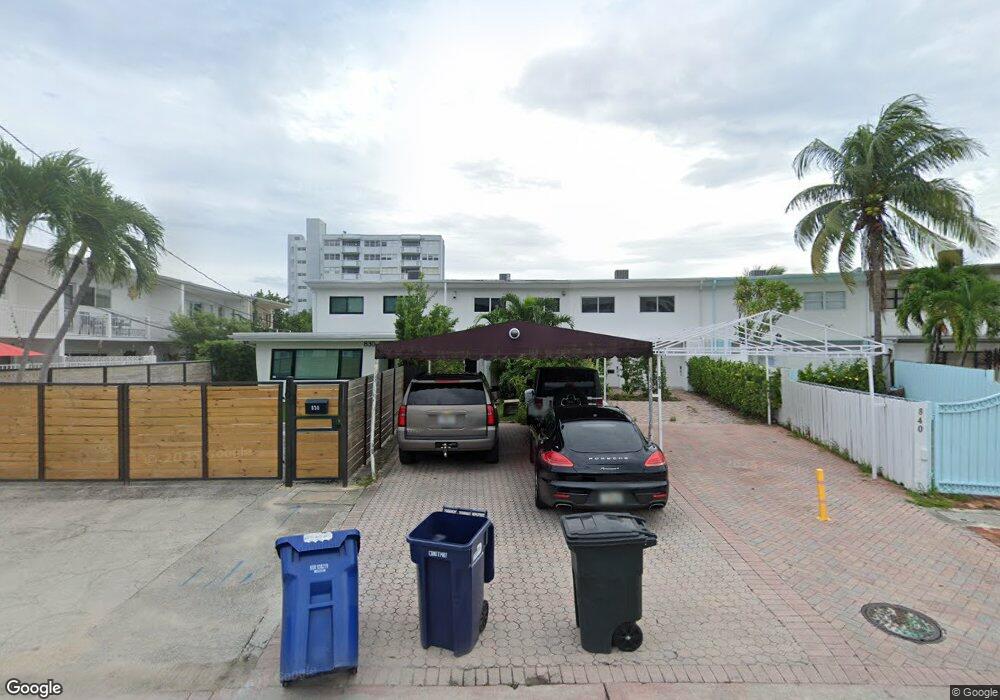
832 Raymond St Unit O Miami Beach, FL 33141
North Shore NeighborhoodEstimated Value: $1,060,000 - $1,515,000
3
Beds
3
Baths
1,776
Sq Ft
$687/Sq Ft
Est. Value
About This Home
This home is located at 832 Raymond St Unit O, Miami Beach, FL 33141 and is currently estimated at $1,219,886, approximately $686 per square foot. 832 Raymond St Unit O is a home located in Miami-Dade County with nearby schools including Biscayne Beach Elementary School, Nautilus Middle School, and Miami Beach Senior High School.
Ownership History
Date
Name
Owned For
Owner Type
Purchase Details
Closed on
May 11, 2017
Sold by
Shaw Michael R and Shaw Susan E
Bought by
Jimenez Alvaro
Current Estimated Value
Home Financials for this Owner
Home Financials are based on the most recent Mortgage that was taken out on this home.
Original Mortgage
$209,000
Outstanding Balance
$173,714
Interest Rate
4.08%
Mortgage Type
New Conventional
Estimated Equity
$1,046,172
Purchase Details
Closed on
Apr 6, 2004
Sold by
Hall Theodore E and Weiner Vicki E
Bought by
Shaw Michael R and Shaw Susan E
Home Financials for this Owner
Home Financials are based on the most recent Mortgage that was taken out on this home.
Original Mortgage
$295,000
Interest Rate
5.49%
Mortgage Type
Unknown
Purchase Details
Closed on
Apr 8, 1999
Sold by
Vicki E Weiner Tr
Bought by
Hall Theodore E and Weiner Vicki E
Purchase Details
Closed on
Feb 13, 1998
Sold by
Turk Loi Ji
Bought by
Ji Turk Loi
Create a Home Valuation Report for This Property
The Home Valuation Report is an in-depth analysis detailing your home's value as well as a comparison with similar homes in the area
Home Values in the Area
Average Home Value in this Area
Purchase History
| Date | Buyer | Sale Price | Title Company |
|---|---|---|---|
| Jimenez Alvaro | $585,000 | Attorney | |
| Shaw Michael R | $430,000 | -- | |
| Hall Theodore E | $100 | -- | |
| Ji Turk Loi | $100 | -- |
Source: Public Records
Mortgage History
| Date | Status | Borrower | Loan Amount |
|---|---|---|---|
| Open | Jimenez Alvaro | $209,000 | |
| Previous Owner | Shaw Michael R | $295,000 | |
| Previous Owner | Ji Turk Loi | $185,000 | |
| Previous Owner | Ji Turk Loi | $200,000 | |
| Previous Owner | Ji Turk Loi | $58,265 |
Source: Public Records
Tax History Compared to Growth
Tax History
| Year | Tax Paid | Tax Assessment Tax Assessment Total Assessment is a certain percentage of the fair market value that is determined by local assessors to be the total taxable value of land and additions on the property. | Land | Improvement |
|---|---|---|---|---|
| 2025 | $13,153 | $711,932 | -- | -- |
| 2024 | $11,767 | $647,211 | -- | -- |
| 2023 | $11,767 | $588,374 | $0 | $0 |
| 2022 | $10,254 | $534,886 | $0 | $0 |
| 2021 | $9,389 | $486,260 | $0 | $0 |
| 2020 | $8,949 | $462,260 | $0 | $0 |
| 2019 | $9,094 | $469,260 | $0 | $0 |
| 2018 | $8,692 | $462,260 | $0 | $0 |
| 2017 | $8,110 | $425,860 | $0 | $0 |
| 2016 | $7,357 | $370,489 | $0 | $0 |
| 2015 | $7,492 | $336,809 | $0 | $0 |
| 2014 | $6,534 | $306,190 | $0 | $0 |
Source: Public Records
Map
Nearby Homes
- 830 Raymond St
- 7133 Bay Dr Unit 503
- 7133 Bay Dr Unit 401
- 7118 Bonita Dr Unit 405
- 7125 Bay Dr Unit 506
- 7125 Bay Dr Unit 201
- 7300 Wayne Ave Unit 317
- 7300 Wayne Ave Unit 418
- 7207 Bay Dr Unit 25
- 7207 Bay Dr Unit 24
- 7150 Indian Creek Dr Unit 206
- 33 N Shore Dr
- 65 N Shore Dr Unit 31C
- 7441 Wayne Ave Unit 10E
- 7441 Wayne Ave Unit 6B
- 7441 Wayne Ave Unit 11F
- 7441 Wayne Ave Unit 15E
- 7441 Wayne Ave Unit 2B
- 7441 Wayne Ave Unit 10C
- 7441 Wayne Ave Unit 2H
- 832 Raymond St Unit 832
- 832 Raymond St
- 834 Raymond St
- 830 Raymond St Unit 830
- 840 Raymond St Unit 840
- 840 Raymond St
- 840 Raymond St
- 824 Raymond St
- 824 Raymond St Unit 824
- 824 Raymond St
- 842 Raymond St
- 822 Raymond St
- 826 Raymond St
- 826 Raymond St Unit WTRFRT
- 820 Raymond St
- 844 Raymond St
- 814 Raymond St
- 812 Raymond St Unit 812