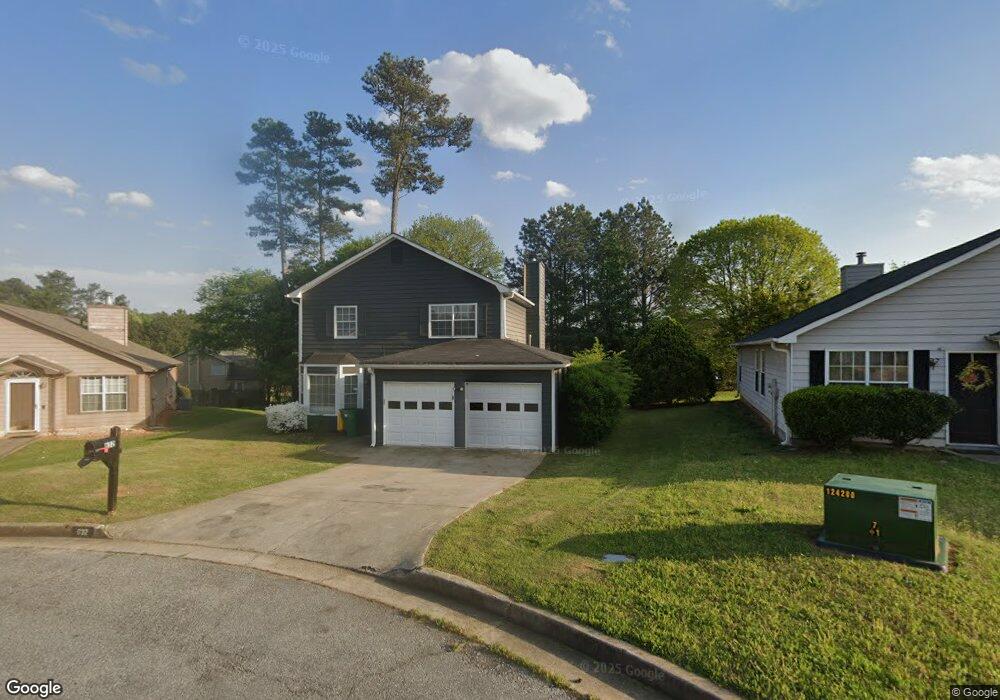
832 Shoals Ct Unit 2 Atlanta, GA 30349
Estimated Value: $207,000 - $228,000
3
Beds
3
Baths
1,525
Sq Ft
$141/Sq Ft
Est. Value
About This Home
This home is located at 832 Shoals Ct Unit 2, Atlanta, GA 30349 and is currently estimated at $215,411, approximately $141 per square foot. 832 Shoals Ct Unit 2 is a home located in Clayton County with nearby schools including Martin Luther King- Jr. Elementary School, North Clayton Middle School, and North Clayton High School.
Ownership History
Date
Name
Owned For
Owner Type
Purchase Details
Closed on
Mar 17, 2021
Sold by
Magnify Real Estate Borrower Spv I Llc
Bought by
Boulton Properties Llc
Current Estimated Value
Purchase Details
Closed on
Jul 10, 2020
Sold by
Magnify Capital Real Estate Fund Lp
Bought by
Magnify Real Estate Borrower Spv I Llc
Home Financials for this Owner
Home Financials are based on the most recent Mortgage that was taken out on this home.
Original Mortgage
$50,000,000
Interest Rate
3.2%
Purchase Details
Closed on
Apr 22, 2020
Sold by
Randolph Kevin B
Bought by
Magnify Capital Real Estate Fund Lp
Purchase Details
Closed on
Oct 19, 1999
Sold by
Bowers Gregory K
Bought by
Randolph Kevin B and Randolph Cheri L
Home Financials for this Owner
Home Financials are based on the most recent Mortgage that was taken out on this home.
Original Mortgage
$99,900
Interest Rate
7.76%
Mortgage Type
New Conventional
Purchase Details
Closed on
Mar 15, 1996
Sold by
Sunrise Bldrs
Bought by
Bowers Gregory
Create a Home Valuation Report for This Property
The Home Valuation Report is an in-depth analysis detailing your home's value as well as a comparison with similar homes in the area
Home Values in the Area
Average Home Value in this Area
Purchase History
| Date | Buyer | Sale Price | Title Company |
|---|---|---|---|
| Boulton Properties Llc | $1,110,000 | -- | |
| Magnify Real Estate Borrower Spv I Llc | -- | -- | |
| Magnify Capital Real Estate Fund Lp | $110,600 | -- | |
| Randolph Kevin B | $99,900 | -- | |
| Bowers Gregory | $88,900 | -- |
Source: Public Records
Mortgage History
| Date | Status | Borrower | Loan Amount |
|---|---|---|---|
| Previous Owner | Magnify Real Estate Borrower Spv I Llc | $50,000,000 | |
| Previous Owner | Randolph Kevin B | $99,900 | |
| Closed | Bowers Gregory | $0 |
Source: Public Records
Tax History Compared to Growth
Tax History
| Year | Tax Paid | Tax Assessment Tax Assessment Total Assessment is a certain percentage of the fair market value that is determined by local assessors to be the total taxable value of land and additions on the property. | Land | Improvement |
|---|---|---|---|---|
| 2024 | $3,335 | $85,480 | $7,200 | $78,280 |
| 2023 | $2,022 | $84,000 | $7,200 | $76,800 |
| 2022 | $2,089 | $63,240 | $7,200 | $56,040 |
| 2021 | $1,747 | $44,240 | $6,480 | $37,760 |
| 2020 | $1,163 | $39,082 | $7,200 | $31,882 |
| 2019 | $1,095 | $36,973 | $5,600 | $31,373 |
| 2018 | $922 | $32,701 | $5,600 | $27,101 |
| 2017 | $612 | $25,045 | $5,600 | $19,445 |
| 2016 | $530 | $23,020 | $5,600 | $17,420 |
| 2015 | $578 | $0 | $0 | $0 |
| 2014 | $488 | $22,243 | $6,800 | $15,443 |
Source: Public Records
Map
Nearby Homes
- 5517 Rock Shoals Way
- 5582 Windwood Rd
- 5591 Windwood Rd Unit 2
- 939 Silverwood Dr
- 5488 Windwood Rd
- 5549 Pine Gate Dr
- 834 Pine Shoals Ct
- 807 Boston Common
- 758 Boston Common Unit II
- 5721 Hidden Brook Cir
- 1103 Hidden Brook Trail
- 5428 Glen Haven Dr
- 1114 Summer Brook Rd
- 5426 Glen Haven Dr
- 5407 Glen Haven Dr
- 1145 Brookstone Rd
- 5405 Glen Haven Dr
- 836 Shoals Ct
- 826 Shoals Ct Unit 2
- 835 Pine Shoals Dr
- 841 Pine Shoals Dr Unit III
- 829 Pine Shoals Dr
- 5615 Rockingwood Ln Unit 4
- 822 Shoals Ct
- 847 Pine Shoals Dr Unit III
- 848 Shoals Ct Unit 2
- 5609 Rockingwood Ln Unit 4
- 837 Shoals Ct Unit 2
- 821 Shoals Ct
- 831 Shoals Ct
- 853 Pine Shoals Dr
- 854 Shoal
- 843 Shoals Ct Unit 17
- 843 Shoals Ct
- 843 Shoals Ct
- 854 Shoals Ct
- 825 Shoals Ct