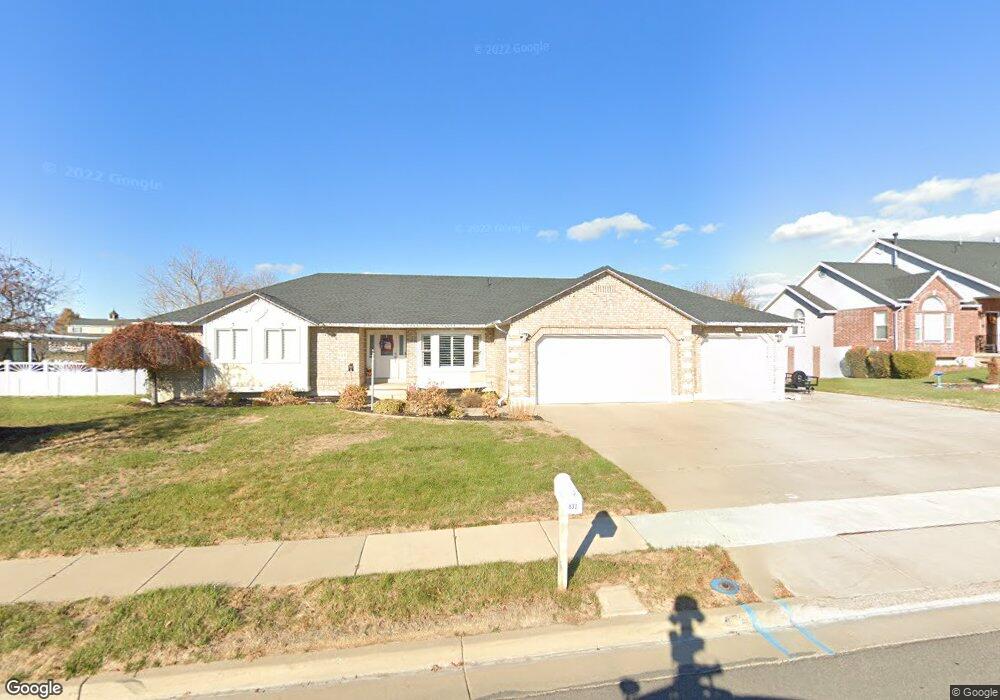
832 W 2300 S Syracuse, UT 84075
Estimated Value: $674,000 - $848,000
6
Beds
4
Baths
3,678
Sq Ft
$202/Sq Ft
Est. Value
About This Home
This home is located at 832 W 2300 S, Syracuse, UT 84075 and is currently estimated at $744,156, approximately $202 per square foot. 832 W 2300 S is a home located in Davis County with nearby schools including Bluff Ridge Elementary, Legacy Junior High School, and Clearfield High School.
Ownership History
Date
Name
Owned For
Owner Type
Purchase Details
Closed on
Aug 3, 2021
Sold by
Ornelas Peggy Jo and The Peggy Jo Ornelas Trust
Bought by
Snyder Dexter R and Snyder Kaylee
Current Estimated Value
Home Financials for this Owner
Home Financials are based on the most recent Mortgage that was taken out on this home.
Original Mortgage
$488,000
Outstanding Balance
$443,458
Interest Rate
3%
Mortgage Type
New Conventional
Estimated Equity
$300,698
Purchase Details
Closed on
Jan 31, 2013
Sold by
Ornelas David and Ornelas Peggy Jo
Bought by
Ornelas Peggy Jo
Purchase Details
Closed on
May 22, 1996
Sold by
Waters Dennis
Bought by
Ornelas David and Ornelas Peggy Jo
Home Financials for this Owner
Home Financials are based on the most recent Mortgage that was taken out on this home.
Original Mortgage
$84,500
Interest Rate
7.97%
Purchase Details
Closed on
Jan 4, 1996
Sold by
Thurgood Kenneth L and Thurgood Jasmine
Bought by
Waters Dennis
Create a Home Valuation Report for This Property
The Home Valuation Report is an in-depth analysis detailing your home's value as well as a comparison with similar homes in the area
Home Values in the Area
Average Home Value in this Area
Purchase History
| Date | Buyer | Sale Price | Title Company |
|---|---|---|---|
| Snyder Dexter R | -- | First American Title | |
| Ornelas Peggy Jo | -- | None Available | |
| Ornelas David | -- | Founders Title Co | |
| Waters Dennis | -- | Bonneville Title Company Inc |
Source: Public Records
Mortgage History
| Date | Status | Borrower | Loan Amount |
|---|---|---|---|
| Open | Snyder Dexter R | $488,000 | |
| Previous Owner | Ornelas David | $84,500 |
Source: Public Records
Tax History
| Year | Tax Paid | Tax Assessment Tax Assessment Total Assessment is a certain percentage of the fair market value that is determined by local assessors to be the total taxable value of land and additions on the property. | Land | Improvement |
|---|---|---|---|---|
| 2025 | $3,996 | $385,550 | $128,486 | $257,064 |
| 2024 | $3,777 | $366,850 | $109,715 | $257,135 |
| 2023 | $3,548 | $628,000 | $152,674 | $475,326 |
| 2022 | $3,730 | $361,900 | $87,406 | $274,494 |
| 2021 | $2,823 | $424,000 | $129,562 | $294,438 |
| 2020 | $2,565 | $373,000 | $111,124 | $261,876 |
| 2019 | $2,452 | $352,000 | $110,748 | $241,252 |
| 2018 | $2,309 | $329,000 | $105,810 | $223,190 |
| 2016 | $2,178 | $162,745 | $40,534 | $122,211 |
| 2015 | $2,085 | $148,390 | $40,534 | $107,856 |
| 2014 | $2,139 | $155,150 | $40,534 | $114,616 |
| 2013 | -- | $148,781 | $38,525 | $110,256 |
Source: Public Records
Map
Nearby Homes
Your Personal Tour Guide
Ask me questions while you tour the home.