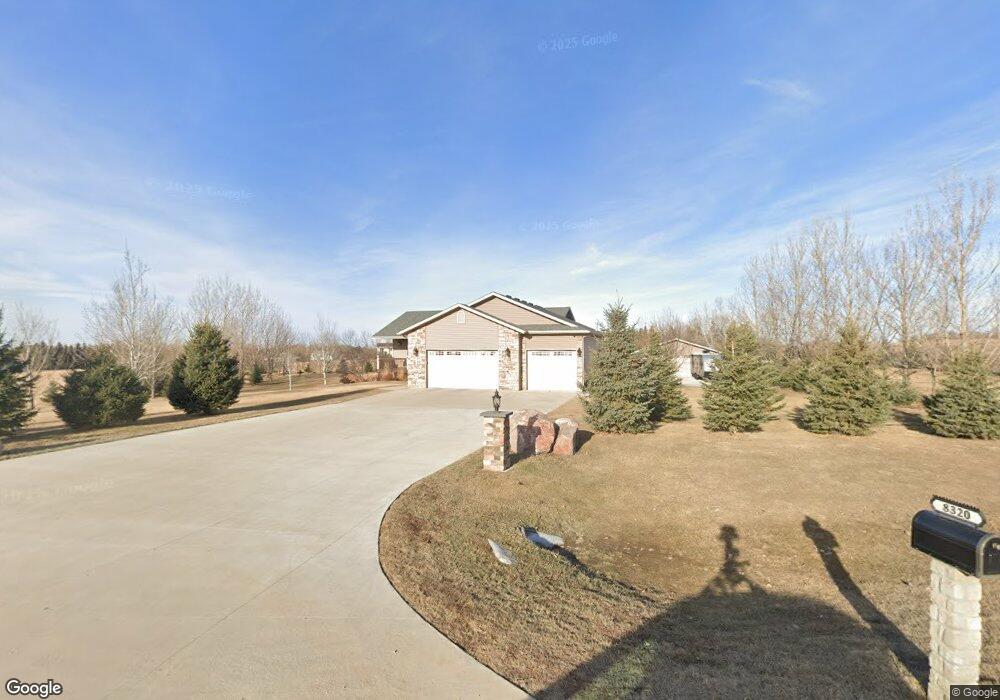
8320 46th St NE Bismarck, ND 58503
Estimated Value: $485,000 - $624,000
2
Beds
--
Bath
1,573
Sq Ft
$347/Sq Ft
Est. Value
About This Home
This home is located at 8320 46th St NE, Bismarck, ND 58503 and is currently estimated at $545,787, approximately $346 per square foot. 8320 46th St NE is a home located in Burleigh County with nearby schools including Rita Murphy Elementary School, Simle Middle School, and Legacy High School.
Ownership History
Date
Name
Owned For
Owner Type
Purchase Details
Closed on
Sep 13, 2012
Sold by
Visionary Homes Llc
Bought by
Butler Justin J
Current Estimated Value
Home Financials for this Owner
Home Financials are based on the most recent Mortgage that was taken out on this home.
Original Mortgage
$180,000
Outstanding Balance
$124,494
Interest Rate
3.56%
Mortgage Type
New Conventional
Estimated Equity
$421,293
Purchase Details
Closed on
May 30, 2012
Sold by
Butler Justin
Bought by
Visionary Homes Llc
Home Financials for this Owner
Home Financials are based on the most recent Mortgage that was taken out on this home.
Original Mortgage
$224,905
Interest Rate
3.92%
Mortgage Type
Credit Line Revolving
Purchase Details
Closed on
Jan 31, 2011
Sold by
Pearson Doug and Pearson Janet
Bought by
Butler Justin
Purchase Details
Closed on
Jan 12, 2011
Sold by
Pearson Cathryn
Bought by
Pearson Doug and Pearson Janet
Create a Home Valuation Report for This Property
The Home Valuation Report is an in-depth analysis detailing your home's value as well as a comparison with similar homes in the area
Home Values in the Area
Average Home Value in this Area
Purchase History
| Date | Buyer | Sale Price | Title Company |
|---|---|---|---|
| Butler Justin J | -- | None Available | |
| Visionary Homes Llc | -- | None Available | |
| Butler Justin | $29,000 | Bismarck Title Co | |
| Pearson Doug | -- | None Available |
Source: Public Records
Mortgage History
| Date | Status | Borrower | Loan Amount |
|---|---|---|---|
| Open | Butler Justin J | $180,000 | |
| Previous Owner | Visionary Homes Llc | $224,905 |
Source: Public Records
Tax History Compared to Growth
Tax History
| Year | Tax Paid | Tax Assessment Tax Assessment Total Assessment is a certain percentage of the fair market value that is determined by local assessors to be the total taxable value of land and additions on the property. | Land | Improvement |
|---|---|---|---|---|
| 2024 | $2,574 | $195,300 | $0 | $0 |
| 2023 | $2,966 | $187,950 | $0 | $0 |
| 2022 | $2,535 | $175,800 | $0 | $0 |
| 2021 | $2,532 | $167,800 | $0 | $0 |
| 2020 | $2,460 | $162,050 | $0 | $0 |
| 2019 | $2,490 | $162,050 | $0 | $0 |
| 2018 | $2,278 | $162,050 | $23,850 | $138,200 |
| 2017 | $2,225 | $162,050 | $138,200 | $23,850 |
| 2016 | $2,225 | $162,050 | $23,850 | $138,200 |
| 2014 | -- | $281,200 | $46,300 | $234,900 |
Source: Public Records
Map
Nearby Homes
- 8216 44th St NE
- 00 Tba Runnel Rd
- Tbd Runnel Rd
- 6800 Centennial Rd
- 6501 52 St NE
- 6605 Shoal Dr
- 6615 Sky Ln
- 9040 Oak Dr
- 6950 Rockridge Dr
- 6952 Rockridge Dr
- 6954 Rockridge Dr
- 6957 Rockridge Dr
- Tbd 52nd St NE
- 0 97th Ave NE
- 5020 Grassy Ln
- Tbd 110th Ave NE
- 7714 41st St NE
- Tbd State Highway 83
- 7427 Sandstone Dr
- 110th Ave NE
- 8230 46th St NE
- 8311 46th St NE
- 8325 44th St NE
- 8309 44th St NE
- 8221 46th St NE
- 8215 44th St NE
- 8140 46th St NE
- 8137 44th St NE
- 8324 44th St NE
- 8121 46th St NE
- 8308 44th St NE
- 4420 Crescent Ridge Rd
- 8138 44th St NE
- 4541 Crescent Ridge Rd
- 4421 Crescent Ridge Rd
- 4511 Crescent Ridge Rd
- 4320 Crescent Ridge Rd
- 4327 Crescent Ridge Rd
- 4240 Crescent Ridge Rd
- 4319 Crescent Ridge Rd